1. Introduction
David Coate Consulting (DCC) conducted noise and vibration analyses to assess potential impacts associated with pile driving for the Providence Viaduct Project in Providence, Rhode Island. Construction plans for this highway project call for pile driving in the project area for well over a year. Buildings in the immediate vicinity of pile driving include commercial facilities as well as some residential locations. No vibration-sensitive commercial (e.g. high resolution imaging equipment) facilities are in the immediate vicinity.
This following documents pile driving noise and vibration modeling, ambient noise measurements, mitigation, and recommendations.
2. Pile Driving Noise Modeling
The Federal Transit Administration (FTA) and Federal Highway Administration (FHWA) have developed standardized construction noise and vibration prediction (modeling) and assessment methods. In addition, Boston’s central artery “big dig” (CAT) project resulted in some pioneering construction noise and vibration control because of the long term nature of construction as well as close proximity of residences to construction activity. The noise and vibration source level data and methods used in the present study are based on FTA, FHWA, and CAT methodologies.
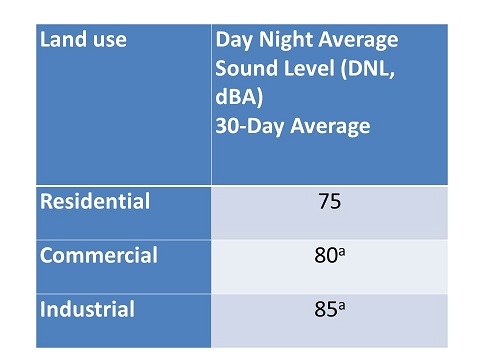
FTA’s construction noise methodology is suitable in this case to evaluate potential noise impacts by month. It is important in this case to evaluate noise impacts over time and over the duration of the project since pile driving activities would move relative to various receptor (building) locations. This in turn would change noise levels at receptor locations. FTA’s thirty day construction noise impact criteria are shown in Table 1.
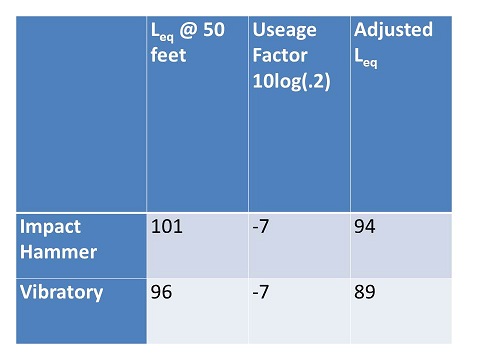
Both impact hammer pile and vibratory sheet driving methods are planned for the project. Vibratory driving generally produces lower noise levels than generated by impact hammer pile driving. Construction noise methods employ a “useage” factor, a means of adjusting noise levels to account for how much the equipment will be used over the course of a day. This is important for pile driving not only in terms of the duration of pile driving, but also the amount of time between impacts. Table 2 shows source pile driving noise levels used for the noise modeling.
Appendix A includes the planned pile driving schedule by month. This data was used to calculate the cumulative effects of the two different types of pile driving, pile driving locations, durations, and whether or not pile driving would occur at night. These calculated source noise level results were used as input to CADNA to generate noise contours. CADNA is an internationally recognized 3D noise modeling software package.
Topographic noise contours were digitized and input into CADNA as well as building footprints and elevations. Such obstacles are important considerations for outdoor sound propagation since buildings and terrain can “block” sound to a certain degree.
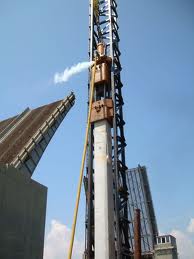
Pile driving locations by month were input into CADNA as well as elevations these locations. It was assumed that pile driving source heights would be 9.1 meters above the ground elevations. This value is half of the typical 18.2 meter starting elevation as the pile is being driven into the ground. Pile driving source height would affect shielding effects due to buildings or other barriers, and thus an average height is a suitable modeling assumption.
Figure 1 through 12 show pile driving noise contours by month.
Figure 1 shows pile driving DNL noise contours for July 2013. The outer magenta color is DNL 75, which represents an impact for residential receptors. As can be seen from this figure, there are no residential buildings at DNL 75 for this month, so no residential mitigation would be needed. However, the foundry building immediately adjacent to pile driving would be above the 80 dBA Leq criteria. Please note that the DNL contours shown in Figure 1 do not correspond to Leq, but subsequent Leq contour analysis reveals that the foundry building would be exposed to noise levels of 85 dBA Leq.
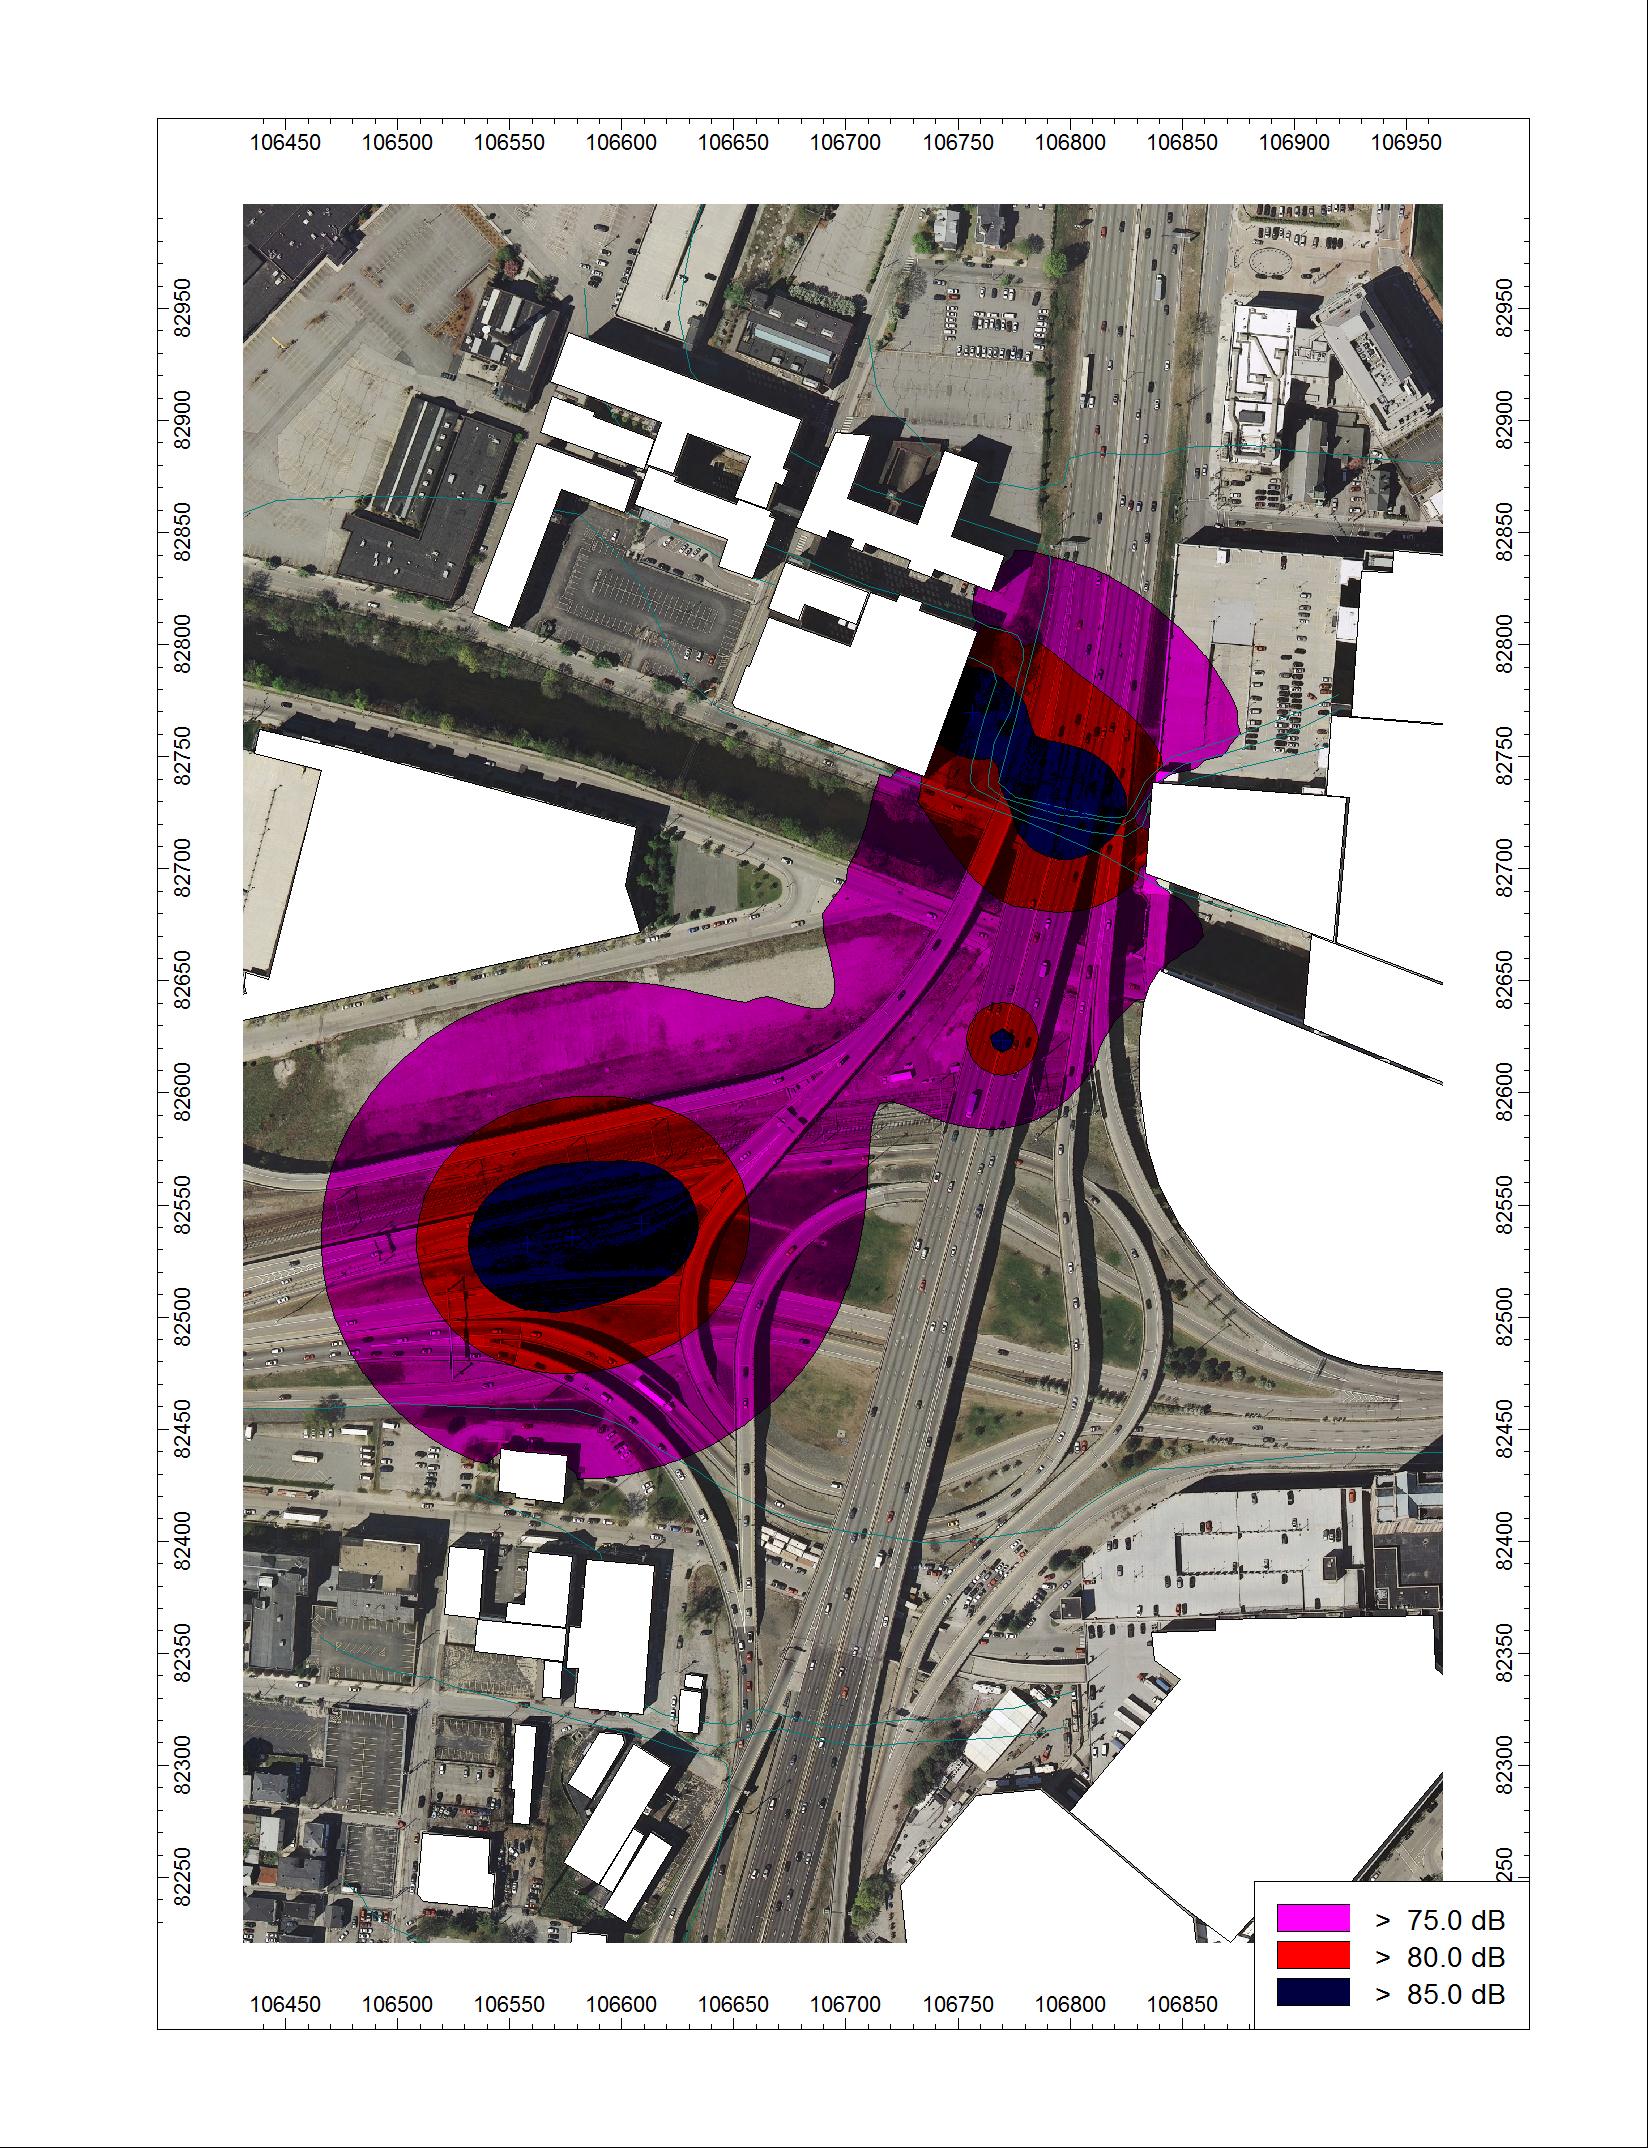
Figure 2 shows pile driving DNL noise contours for August 2013. As can be seen by this figure, the 903 residential building to the west of the project would be exposed to noise levels of DNL 75 and higher and therefore mitigation should be considered if feasible and reasonable. No other residential locations would experience noise levels in excess of the residential criterion. Subsequent Leq noise contour analysis reveals that the foundry would be at 94 dBA Leq, the C.J. Fox building would be at 93 dBA, and the bar (Saints and Sinners Lounge) adjacent to the C.J. Fox building would be at 82 dBA. These locations would be above the commercial use limit of 80 dBA Leq.
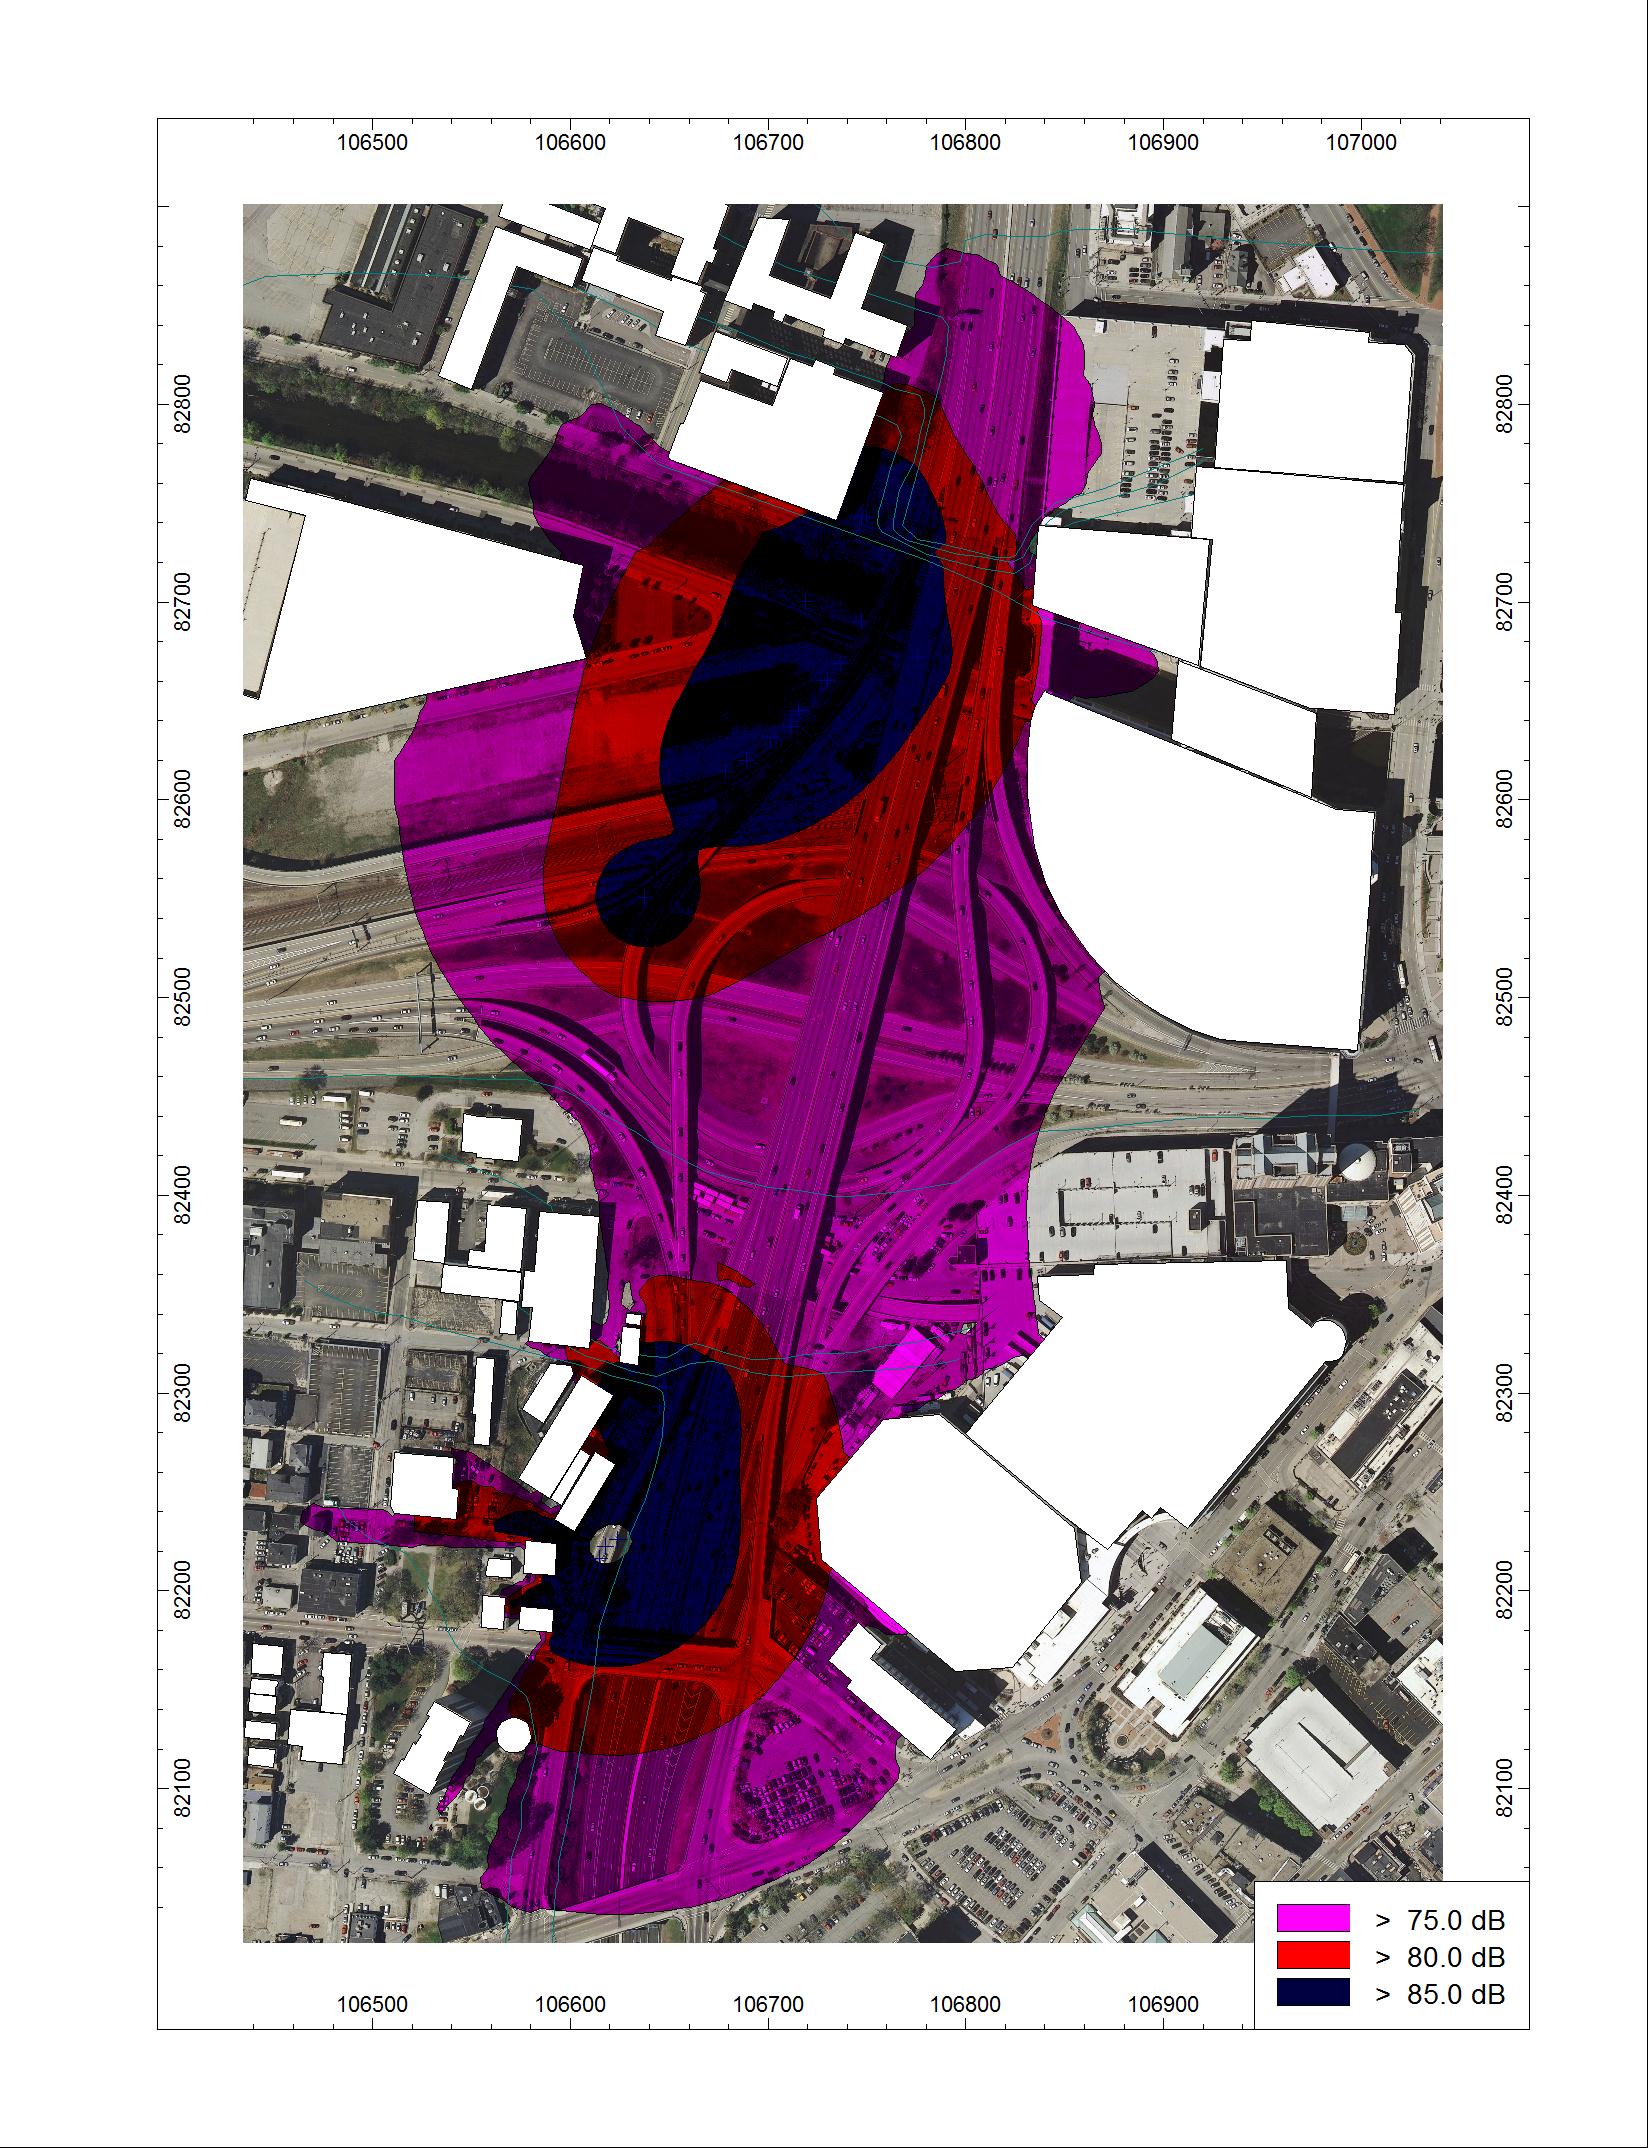
Figure 3 shows pile driving DNL noise contours for September 2013. No residential buildings are included in the 75 DNL noise contours. However subsequent Leq contour analysis reveals that the foundry would be at 80 dBA and the C.J. Fox building and adjacent bar would be at 84 dBA, at or above the commercial use limit of 80 dBA Leq.
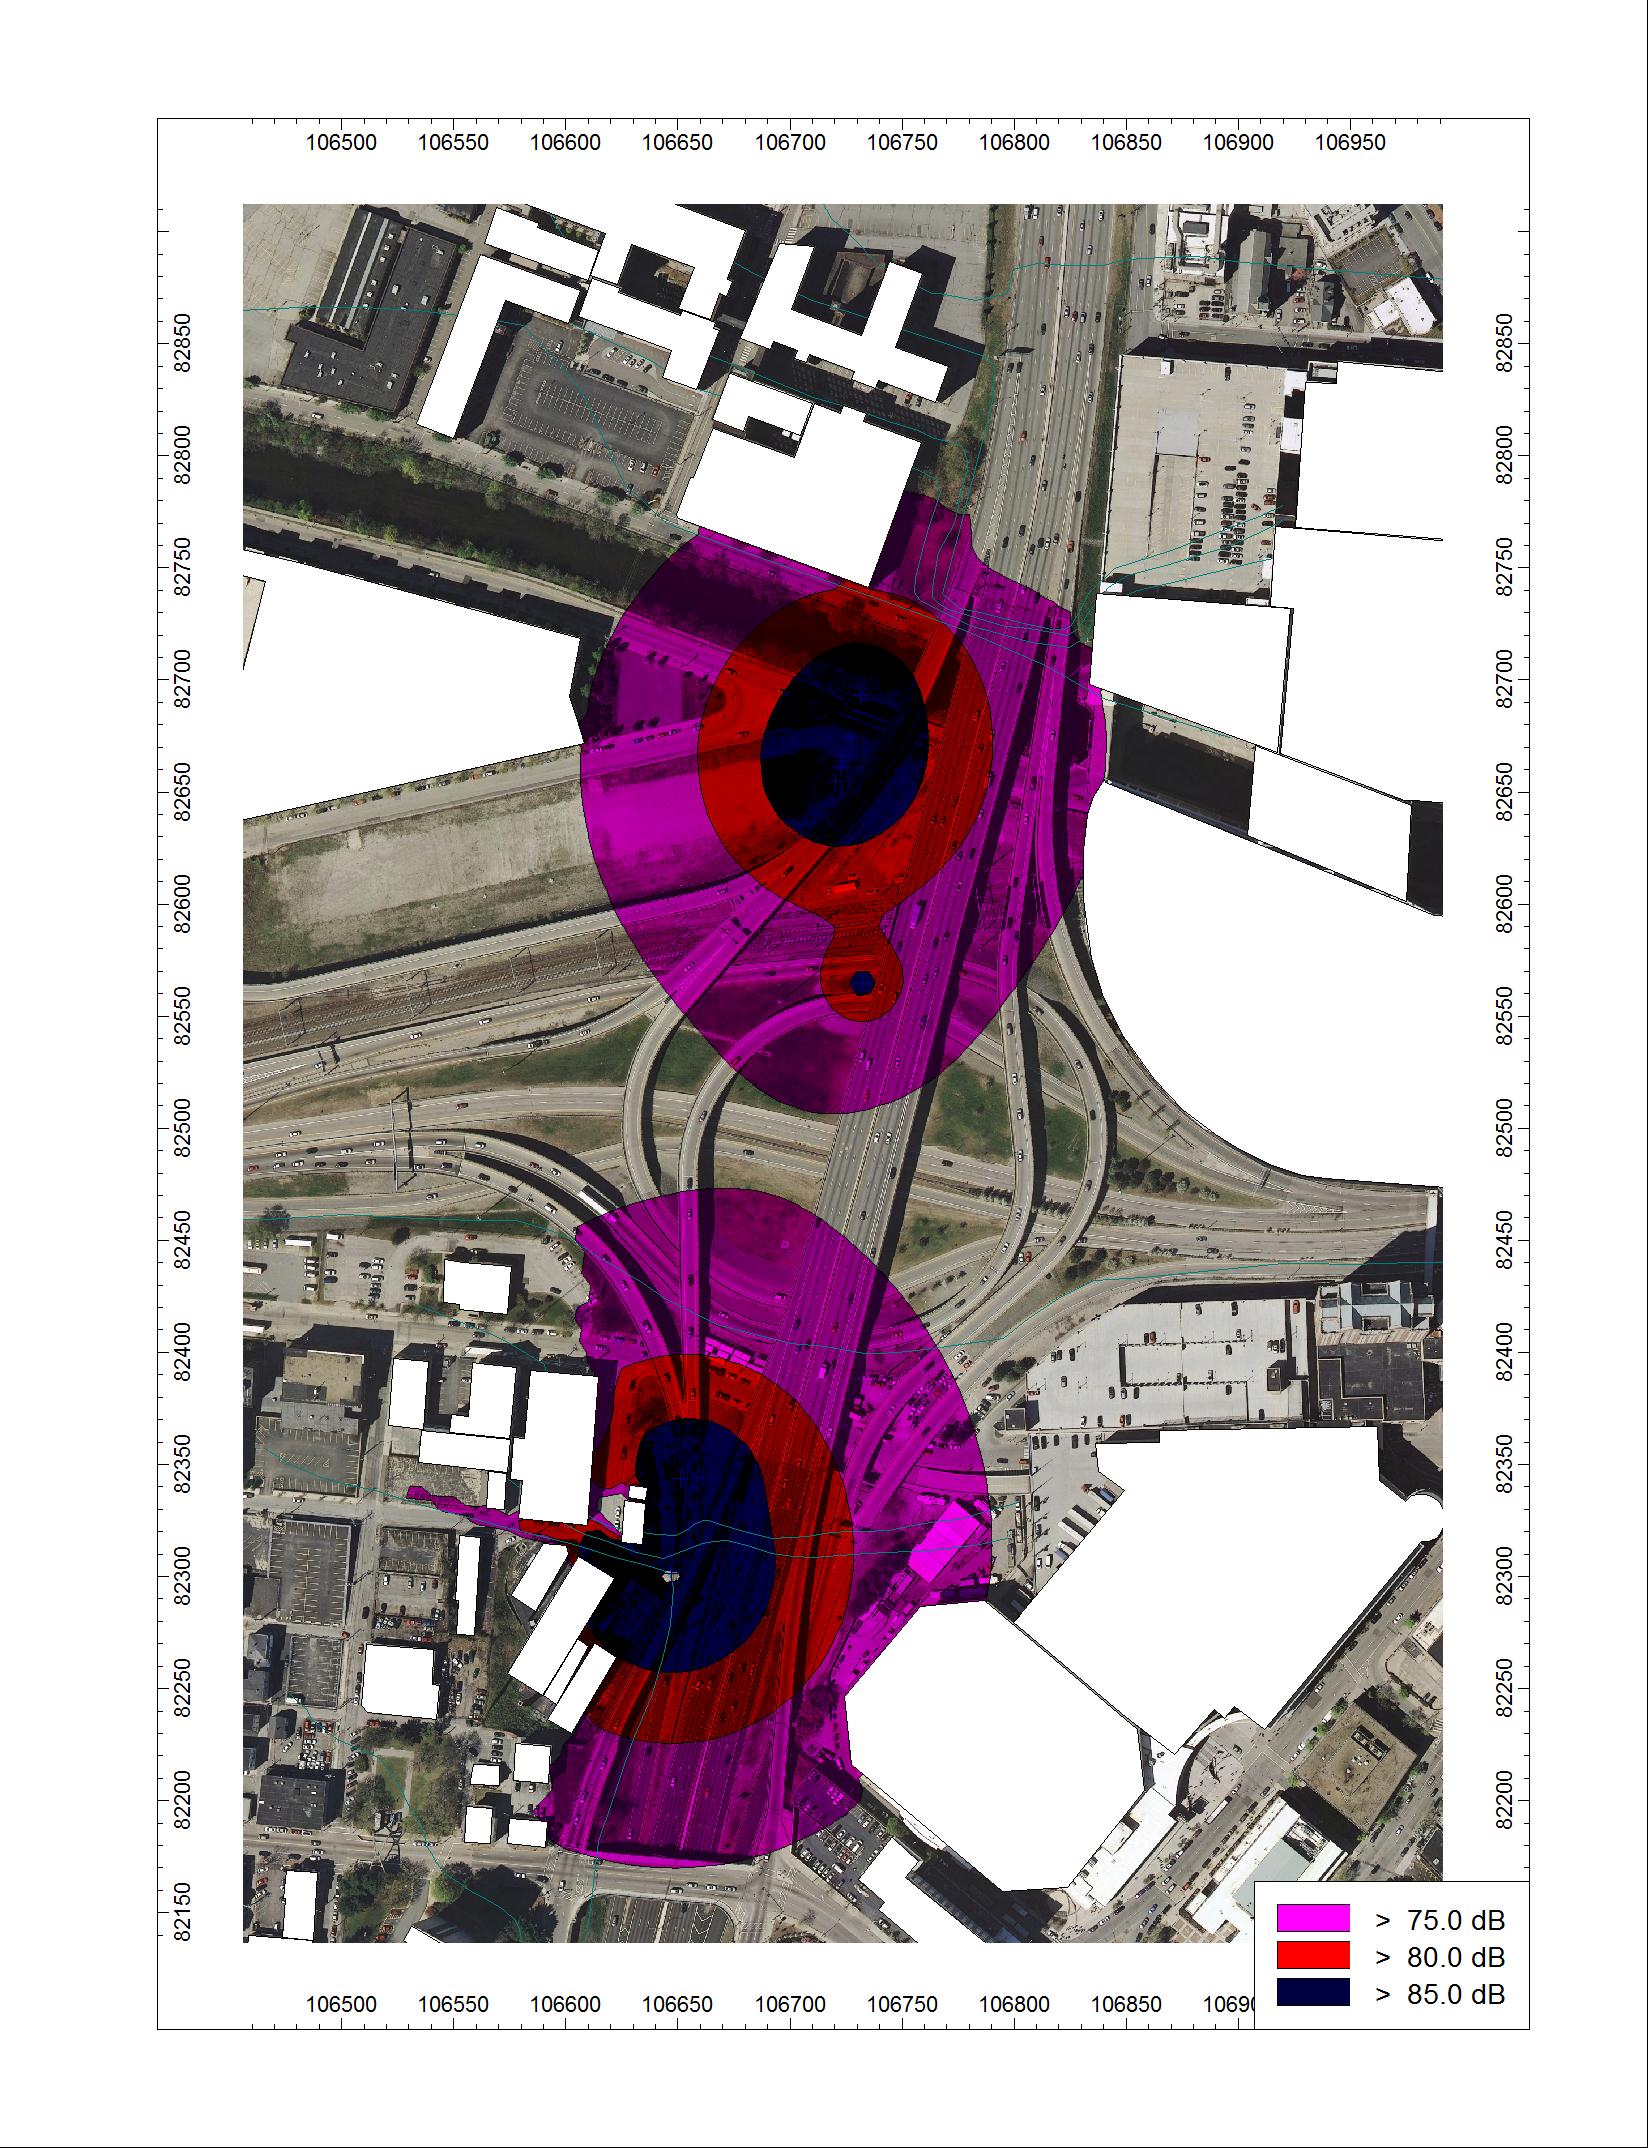
Figure 4 shows pile driving DNL noise contours for October 2013. No residential buildings are included in the 75 DNL noise contours. However subsequent Leq contour analysis reveals that the commercial building next to W. Exchange Street would be at 80 dBA, at the commercial use limit of 80 dBA Leq.
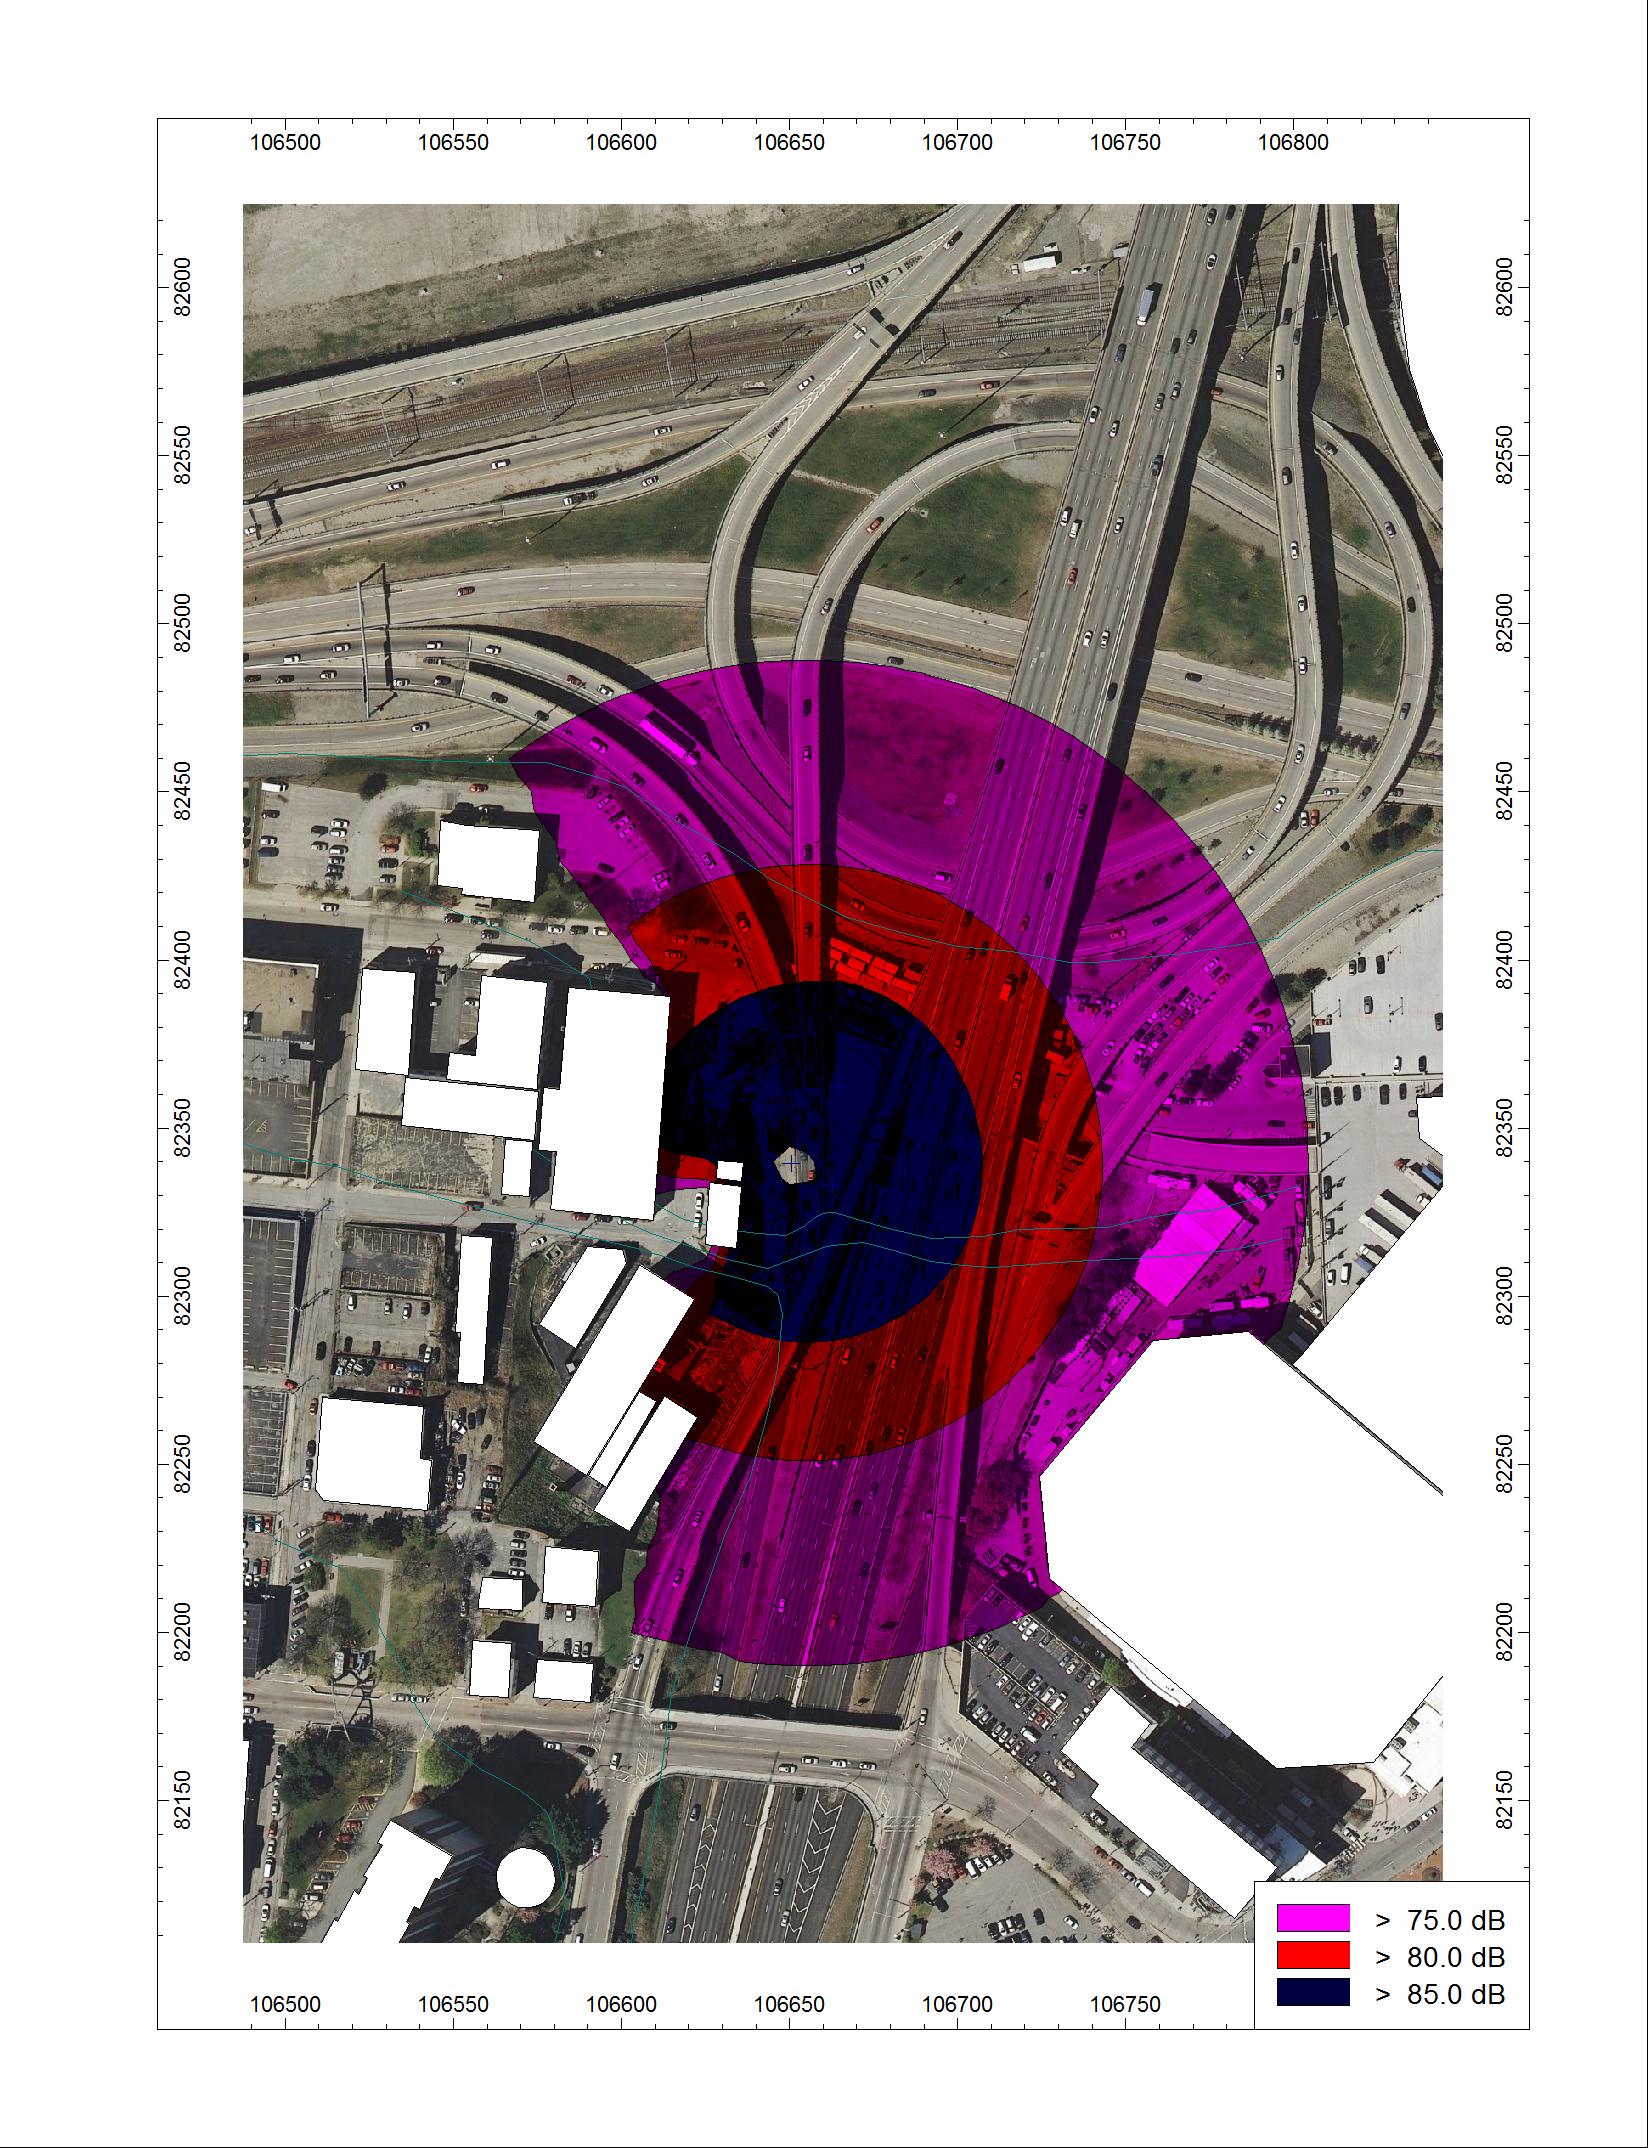
Figure 5 shows pile driving DNL noise contours for November 2013. No residential buildings are included in the 75 DNL noise contours. However subsequent Leq contour analysis reveals that the commercial building next to W. Exchange Street would be at 80 dBA, at the commercial use limit of 80 dBA Leq.
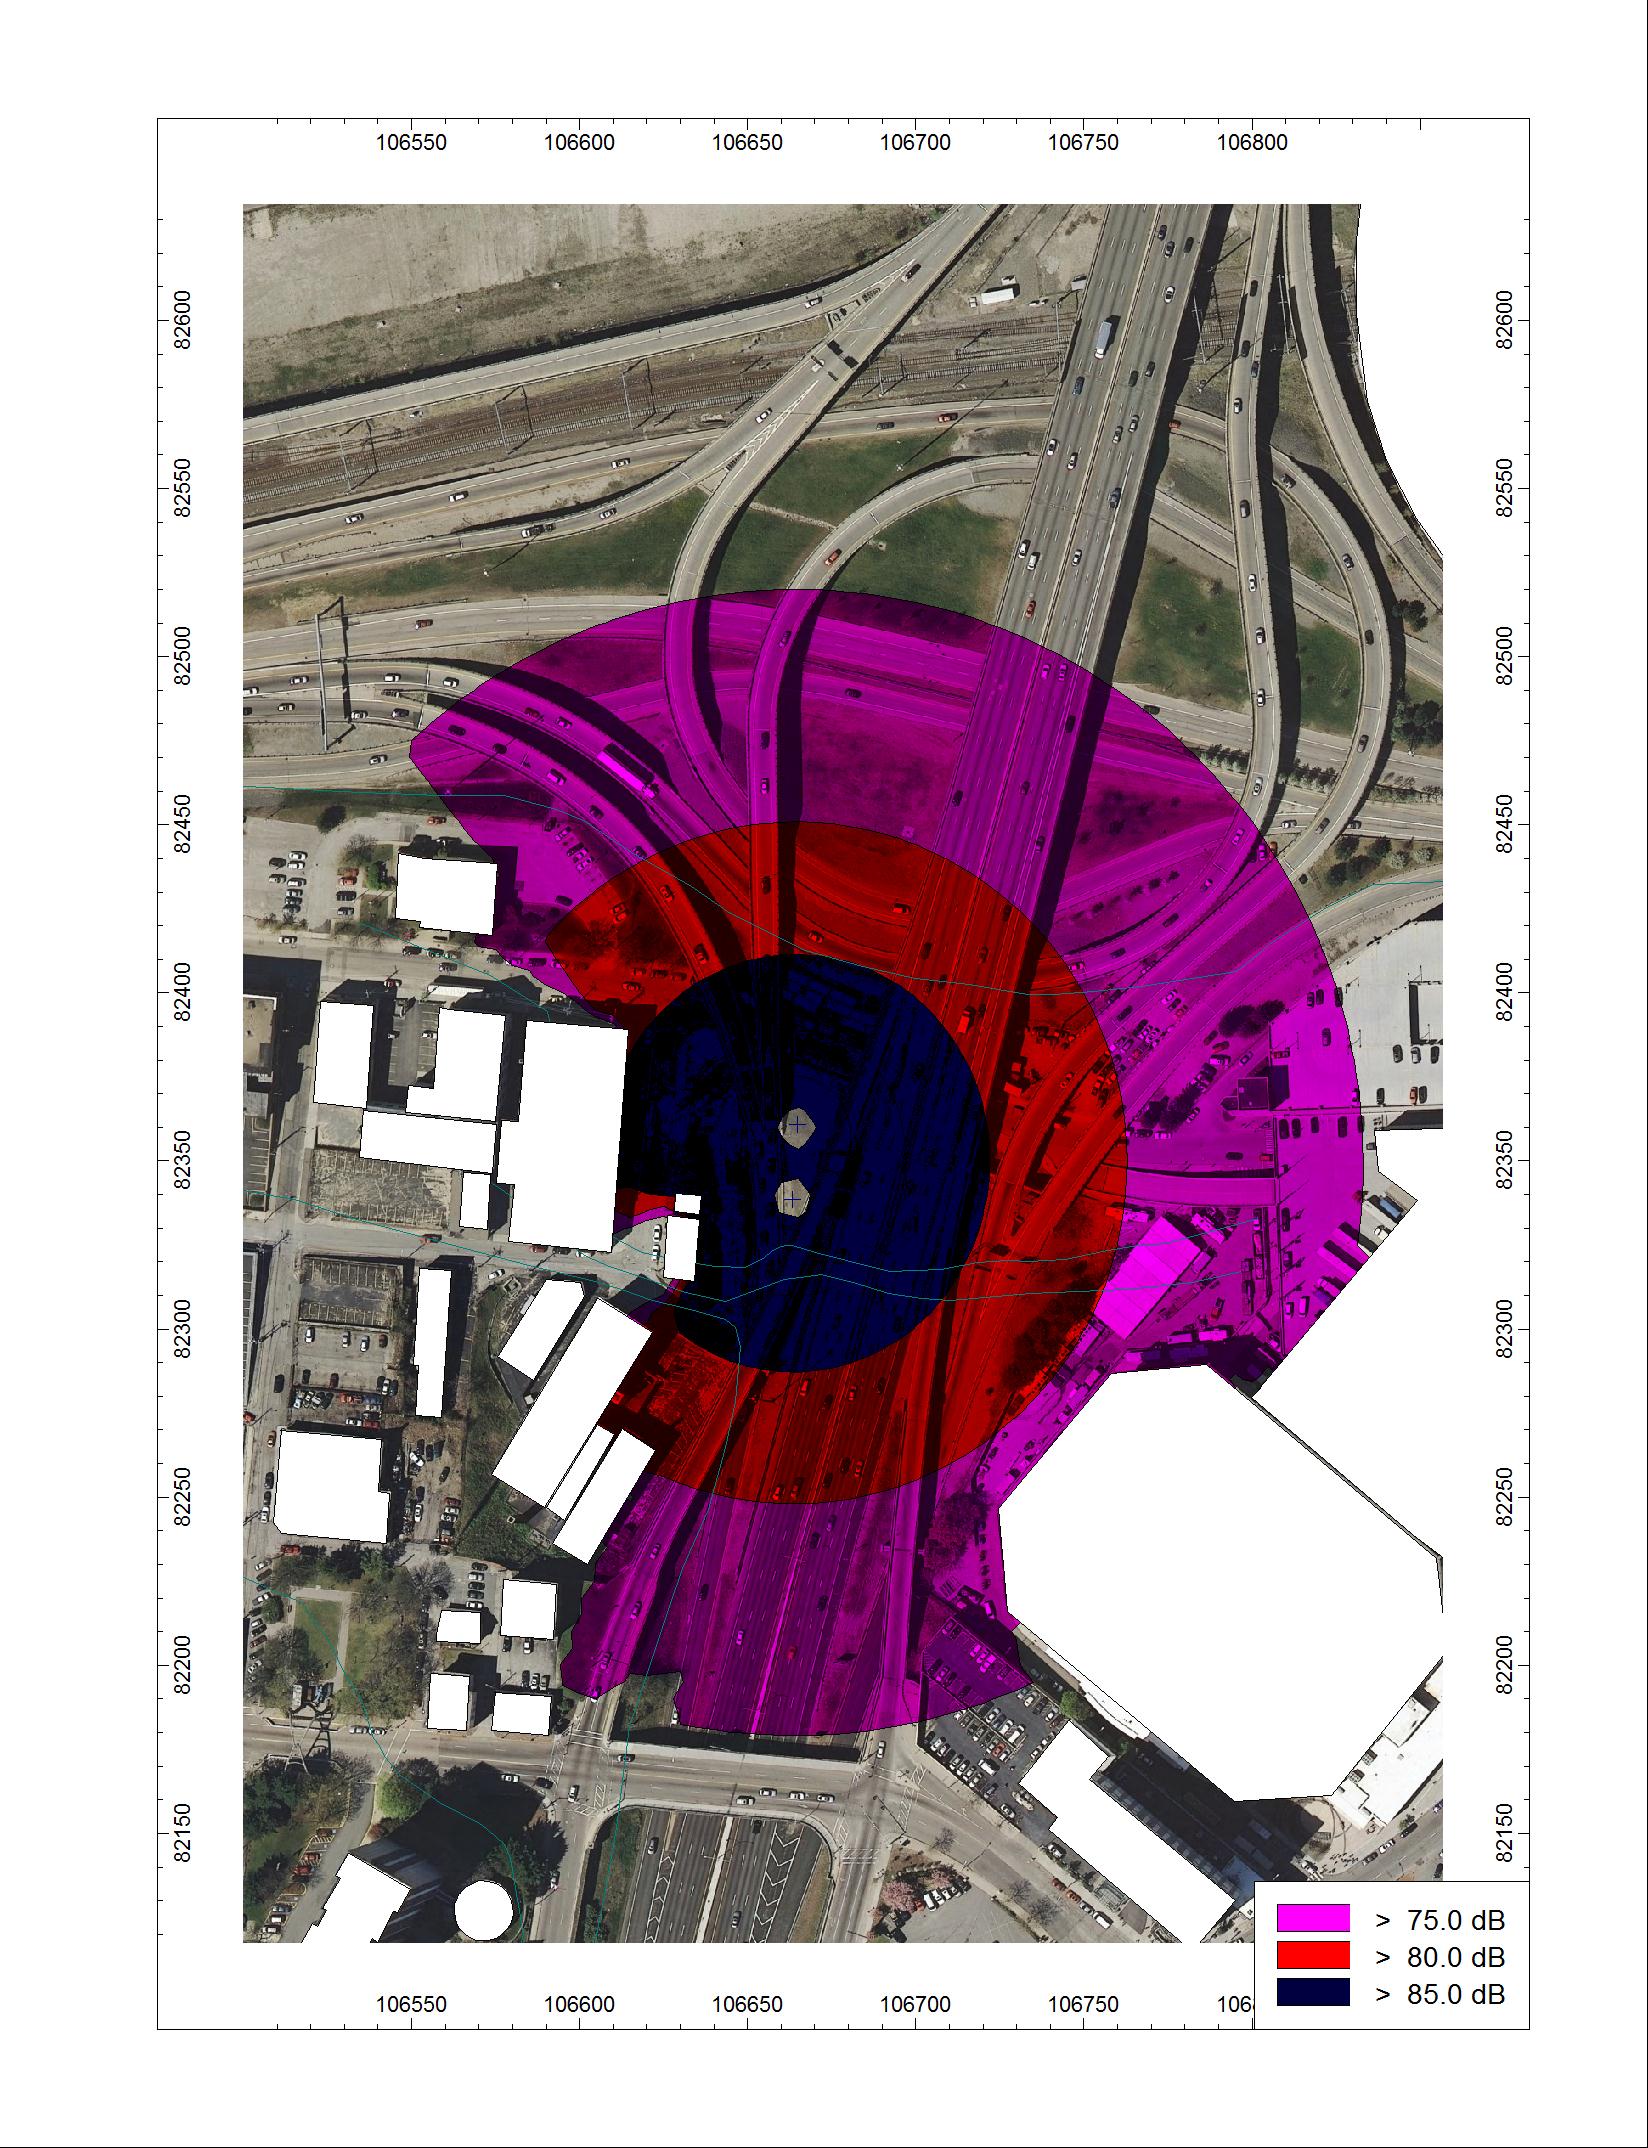
Figure 6 shows pile driving DNL noise contours for March 2014. Two residential buildings are included in the 75 DNL noise contours. Subsequent Leq contour analysis reveals that one commercial building near Atwell’s Avenue would be at the commercial use limit of 80 dBA Leq.
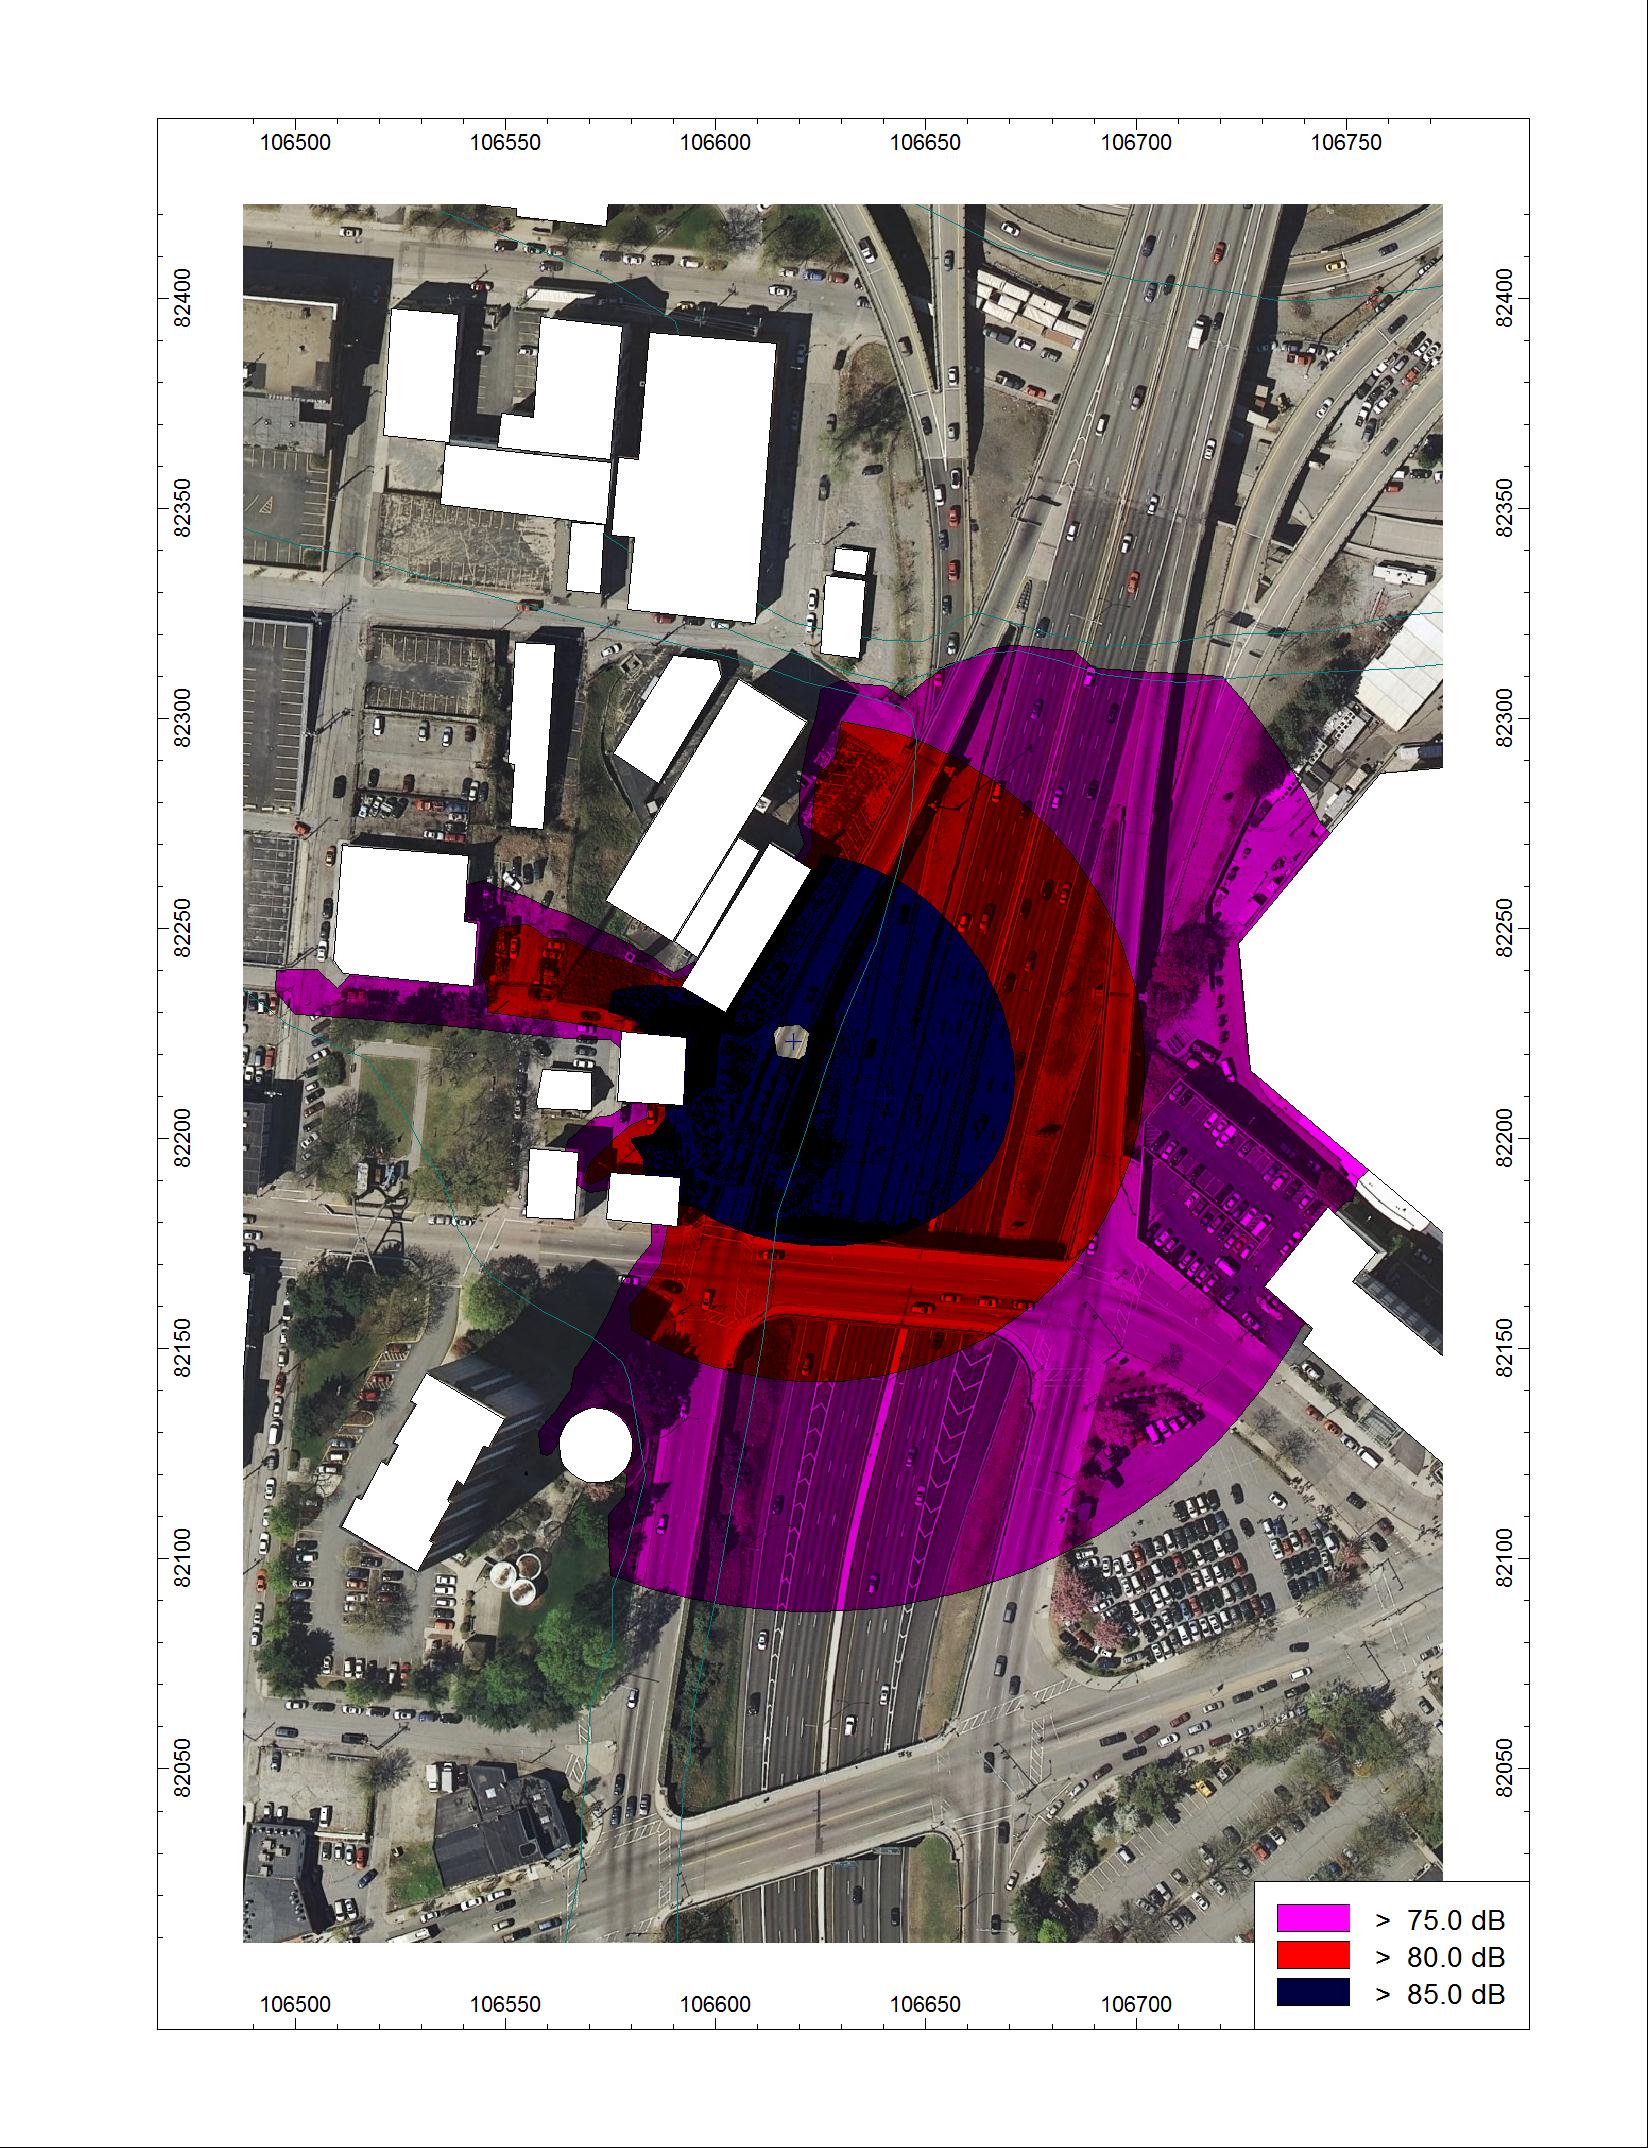
Figure 7 shows pile driving DNL noise contours for August 2014. No residential buildings are included in the 75 DNL noise contours. Since there is no nighttime pile driving planned for August, the DNL contours are equivalent to Leq contours and no commercial buildings fall within the 80 dBA Leq contour.

Figure 8 shows pile driving DNL noise contours for September 2014. No residential buildings are included in the 75 DNL noise contours. Since there is no nighttime pile driving planned for August, the DNL contours are equivalent to Leq contours and no commercial buildings fall within the 80 dBA Leq contour.
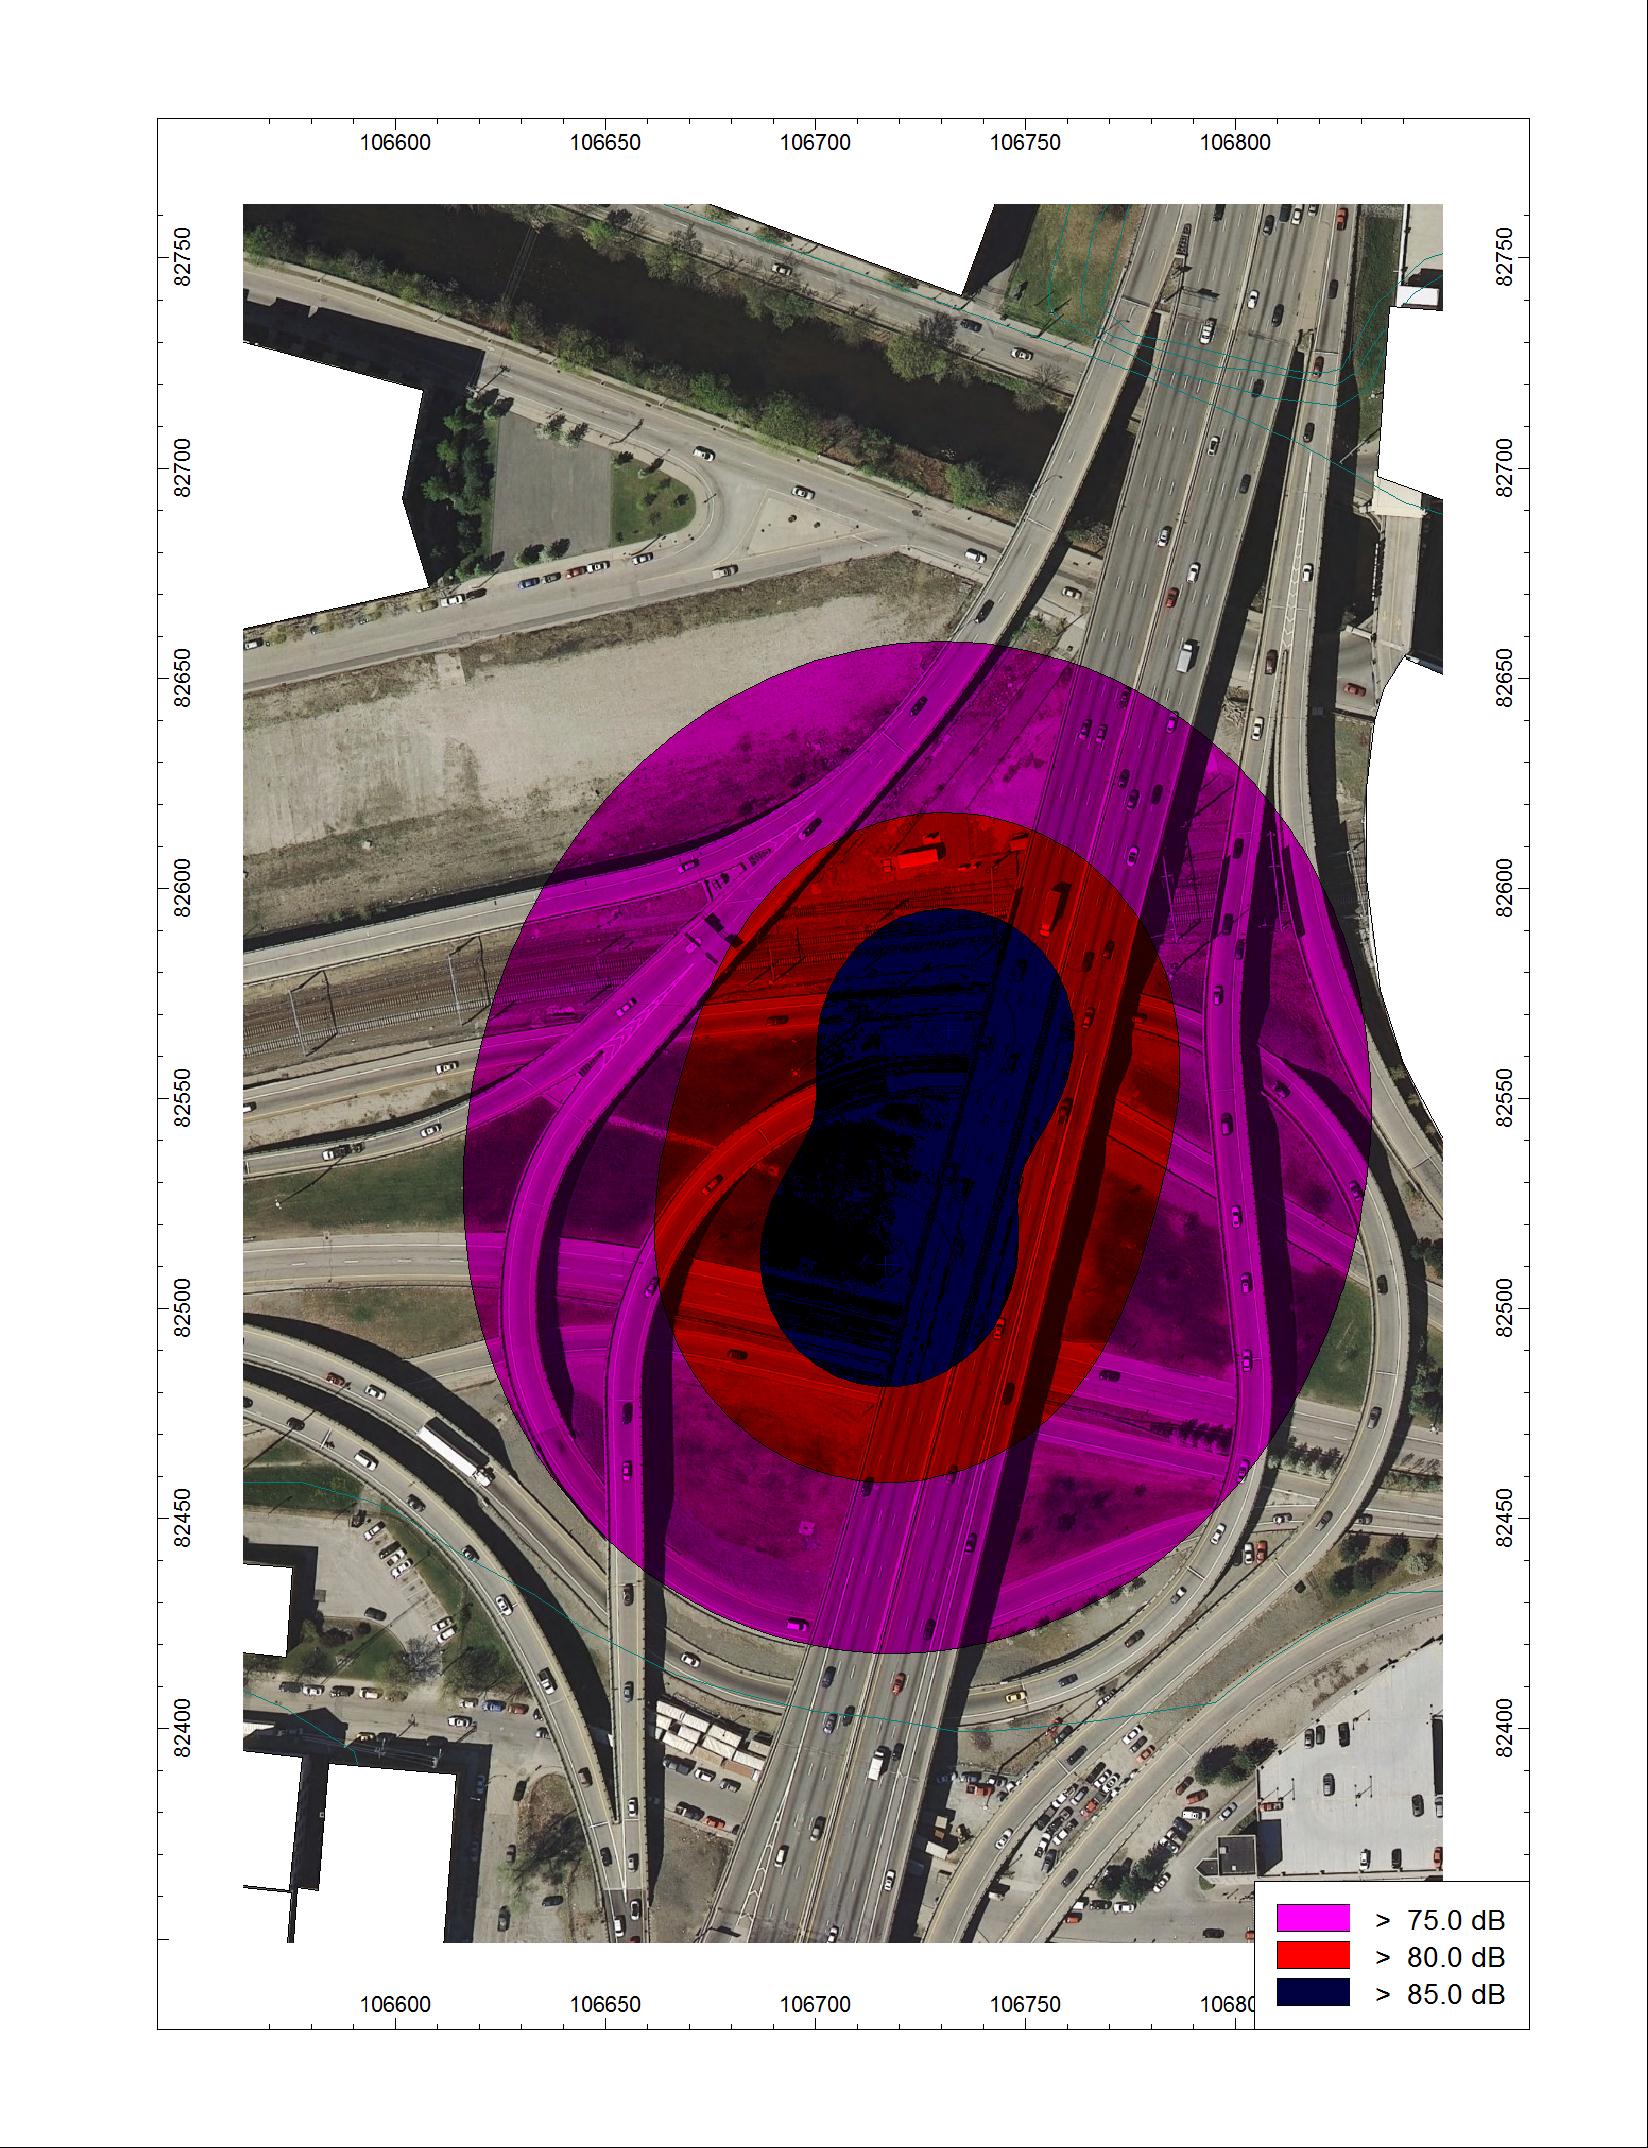
Figure 9 shows pile driving DNL noise contours for October 2014. No residential buildings are included in the 75 DNL noise contours. Since there is no nighttime pile driving planned for August, the DNL contours are equivalent to Leq contours and no commercial buildings fall within the 80 dBA Leq contour.
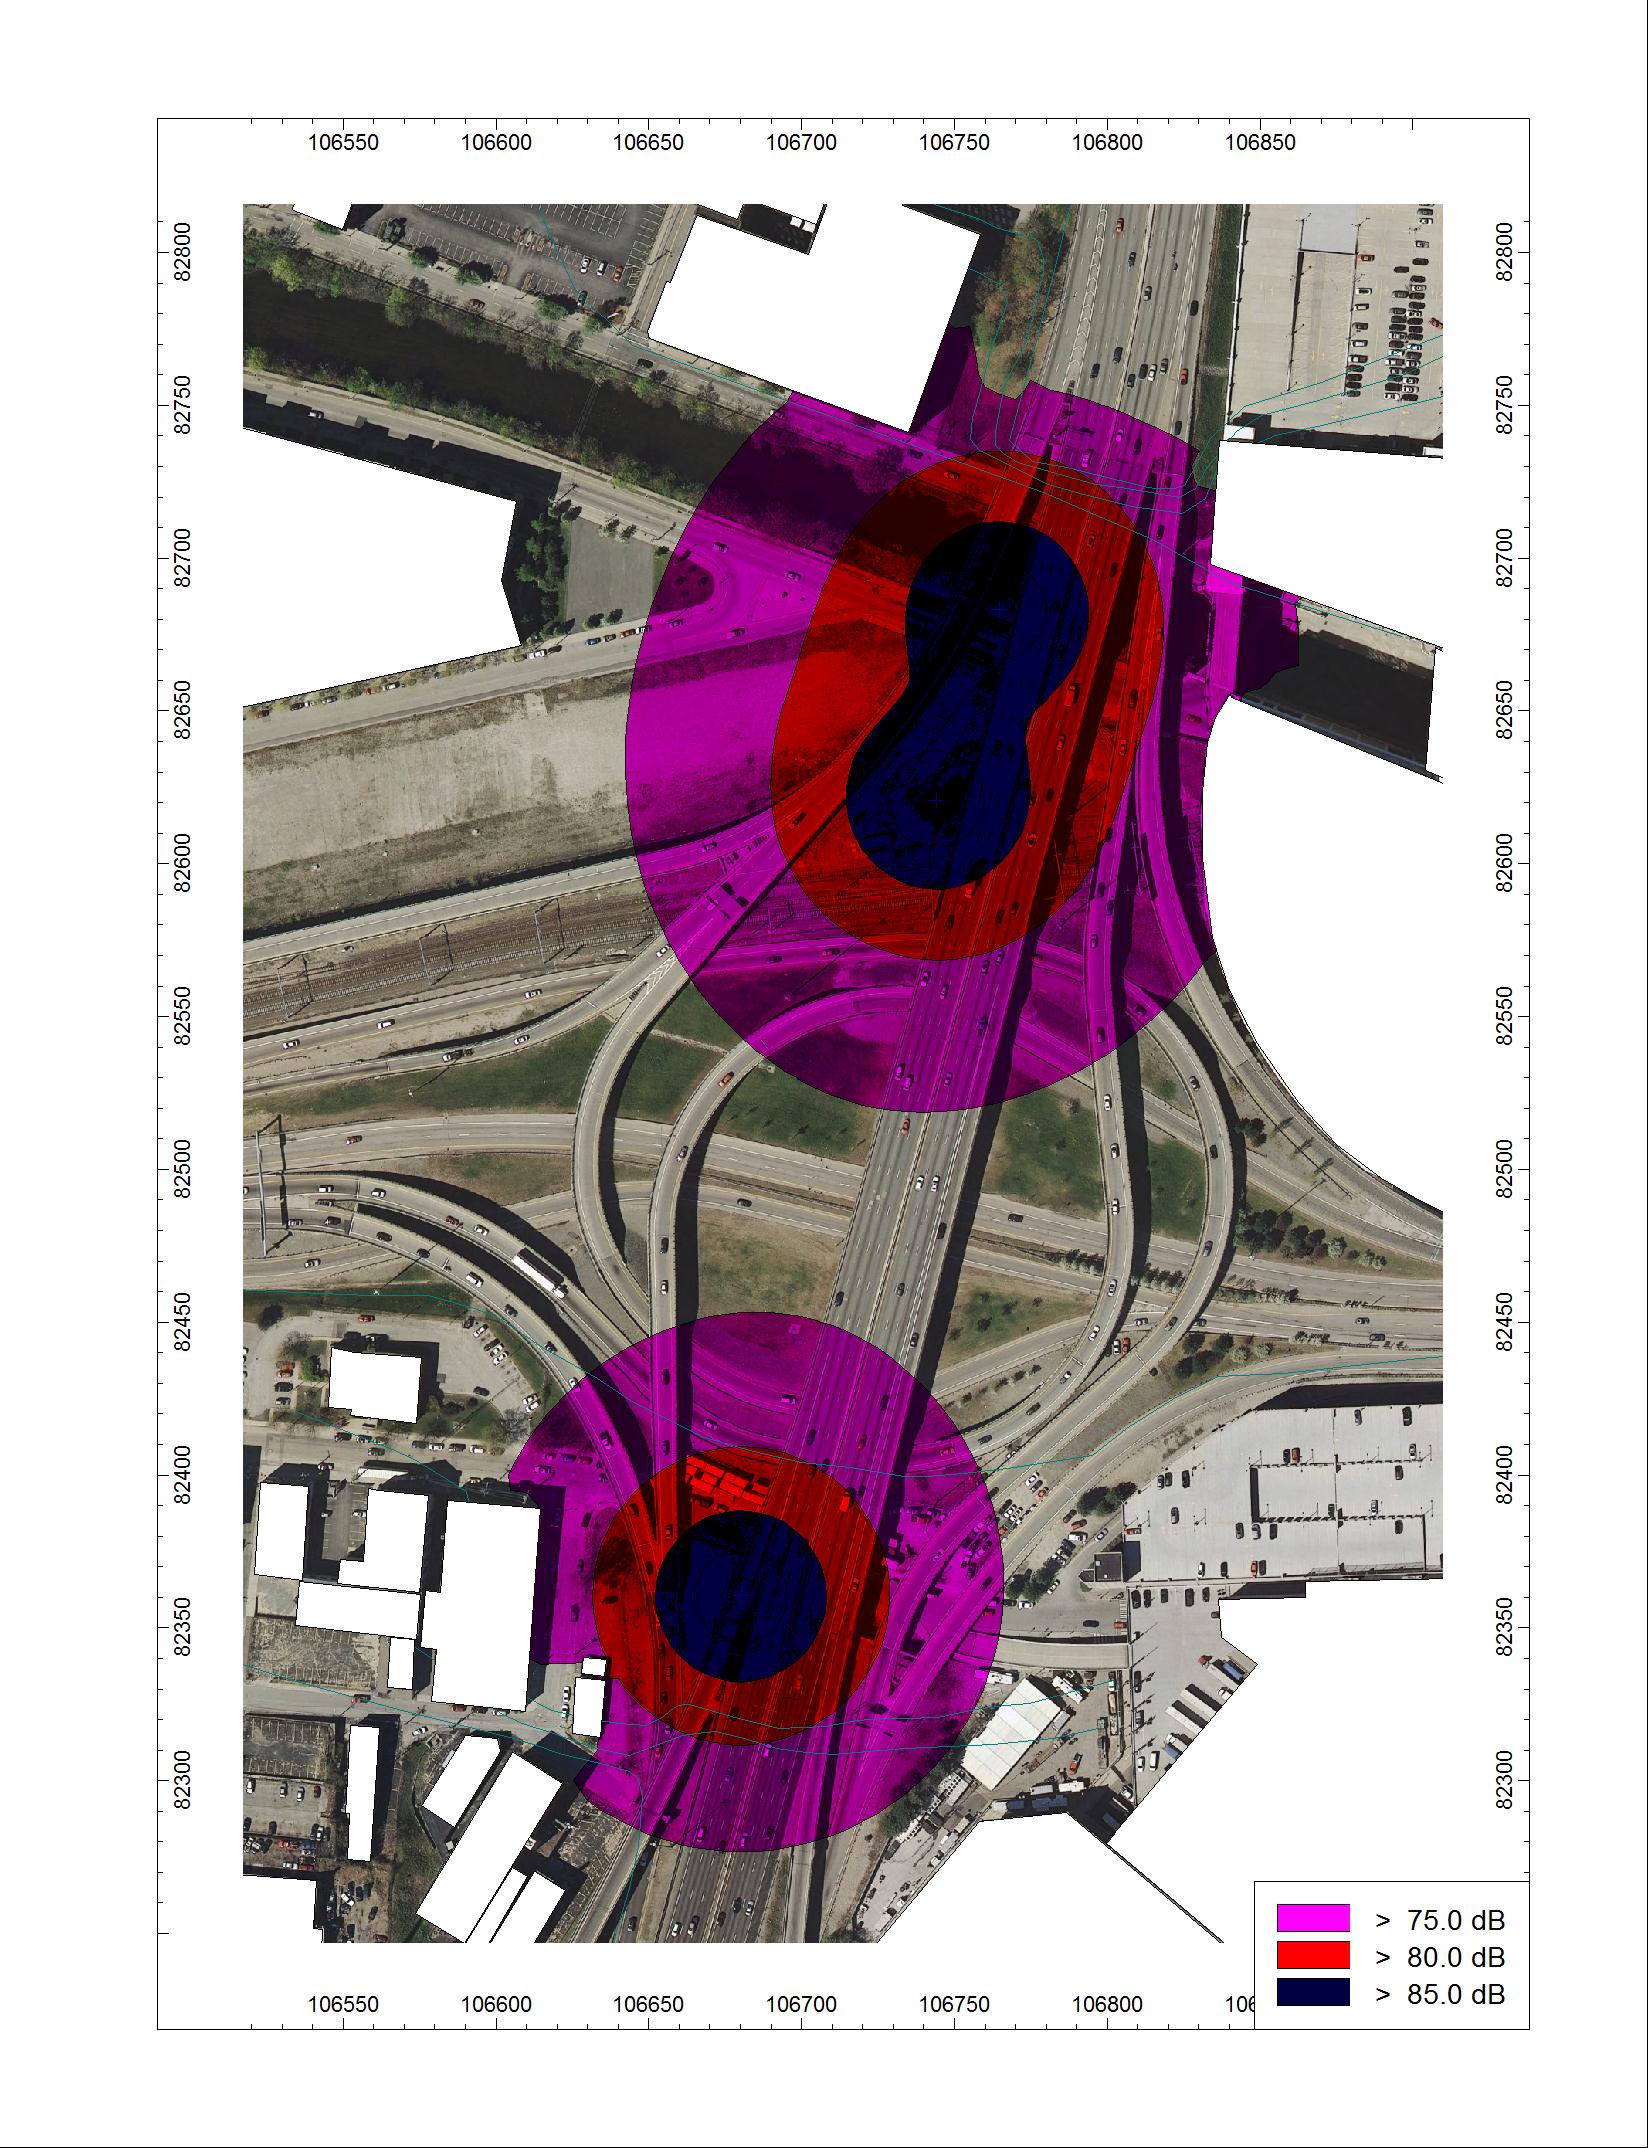
Figure 10 shows pile driving DNL noise contours for December 2014. No residential buildings are included in the 75 DNL noise contours. Since there is no nighttime pile driving planned for August, the DNL contours are equivalent to Leq contours. The foundry building would be exposed to pile driving noise levels of 82 dBA Leq which is above the commercial buildings lmit of 80 dBA Leq.
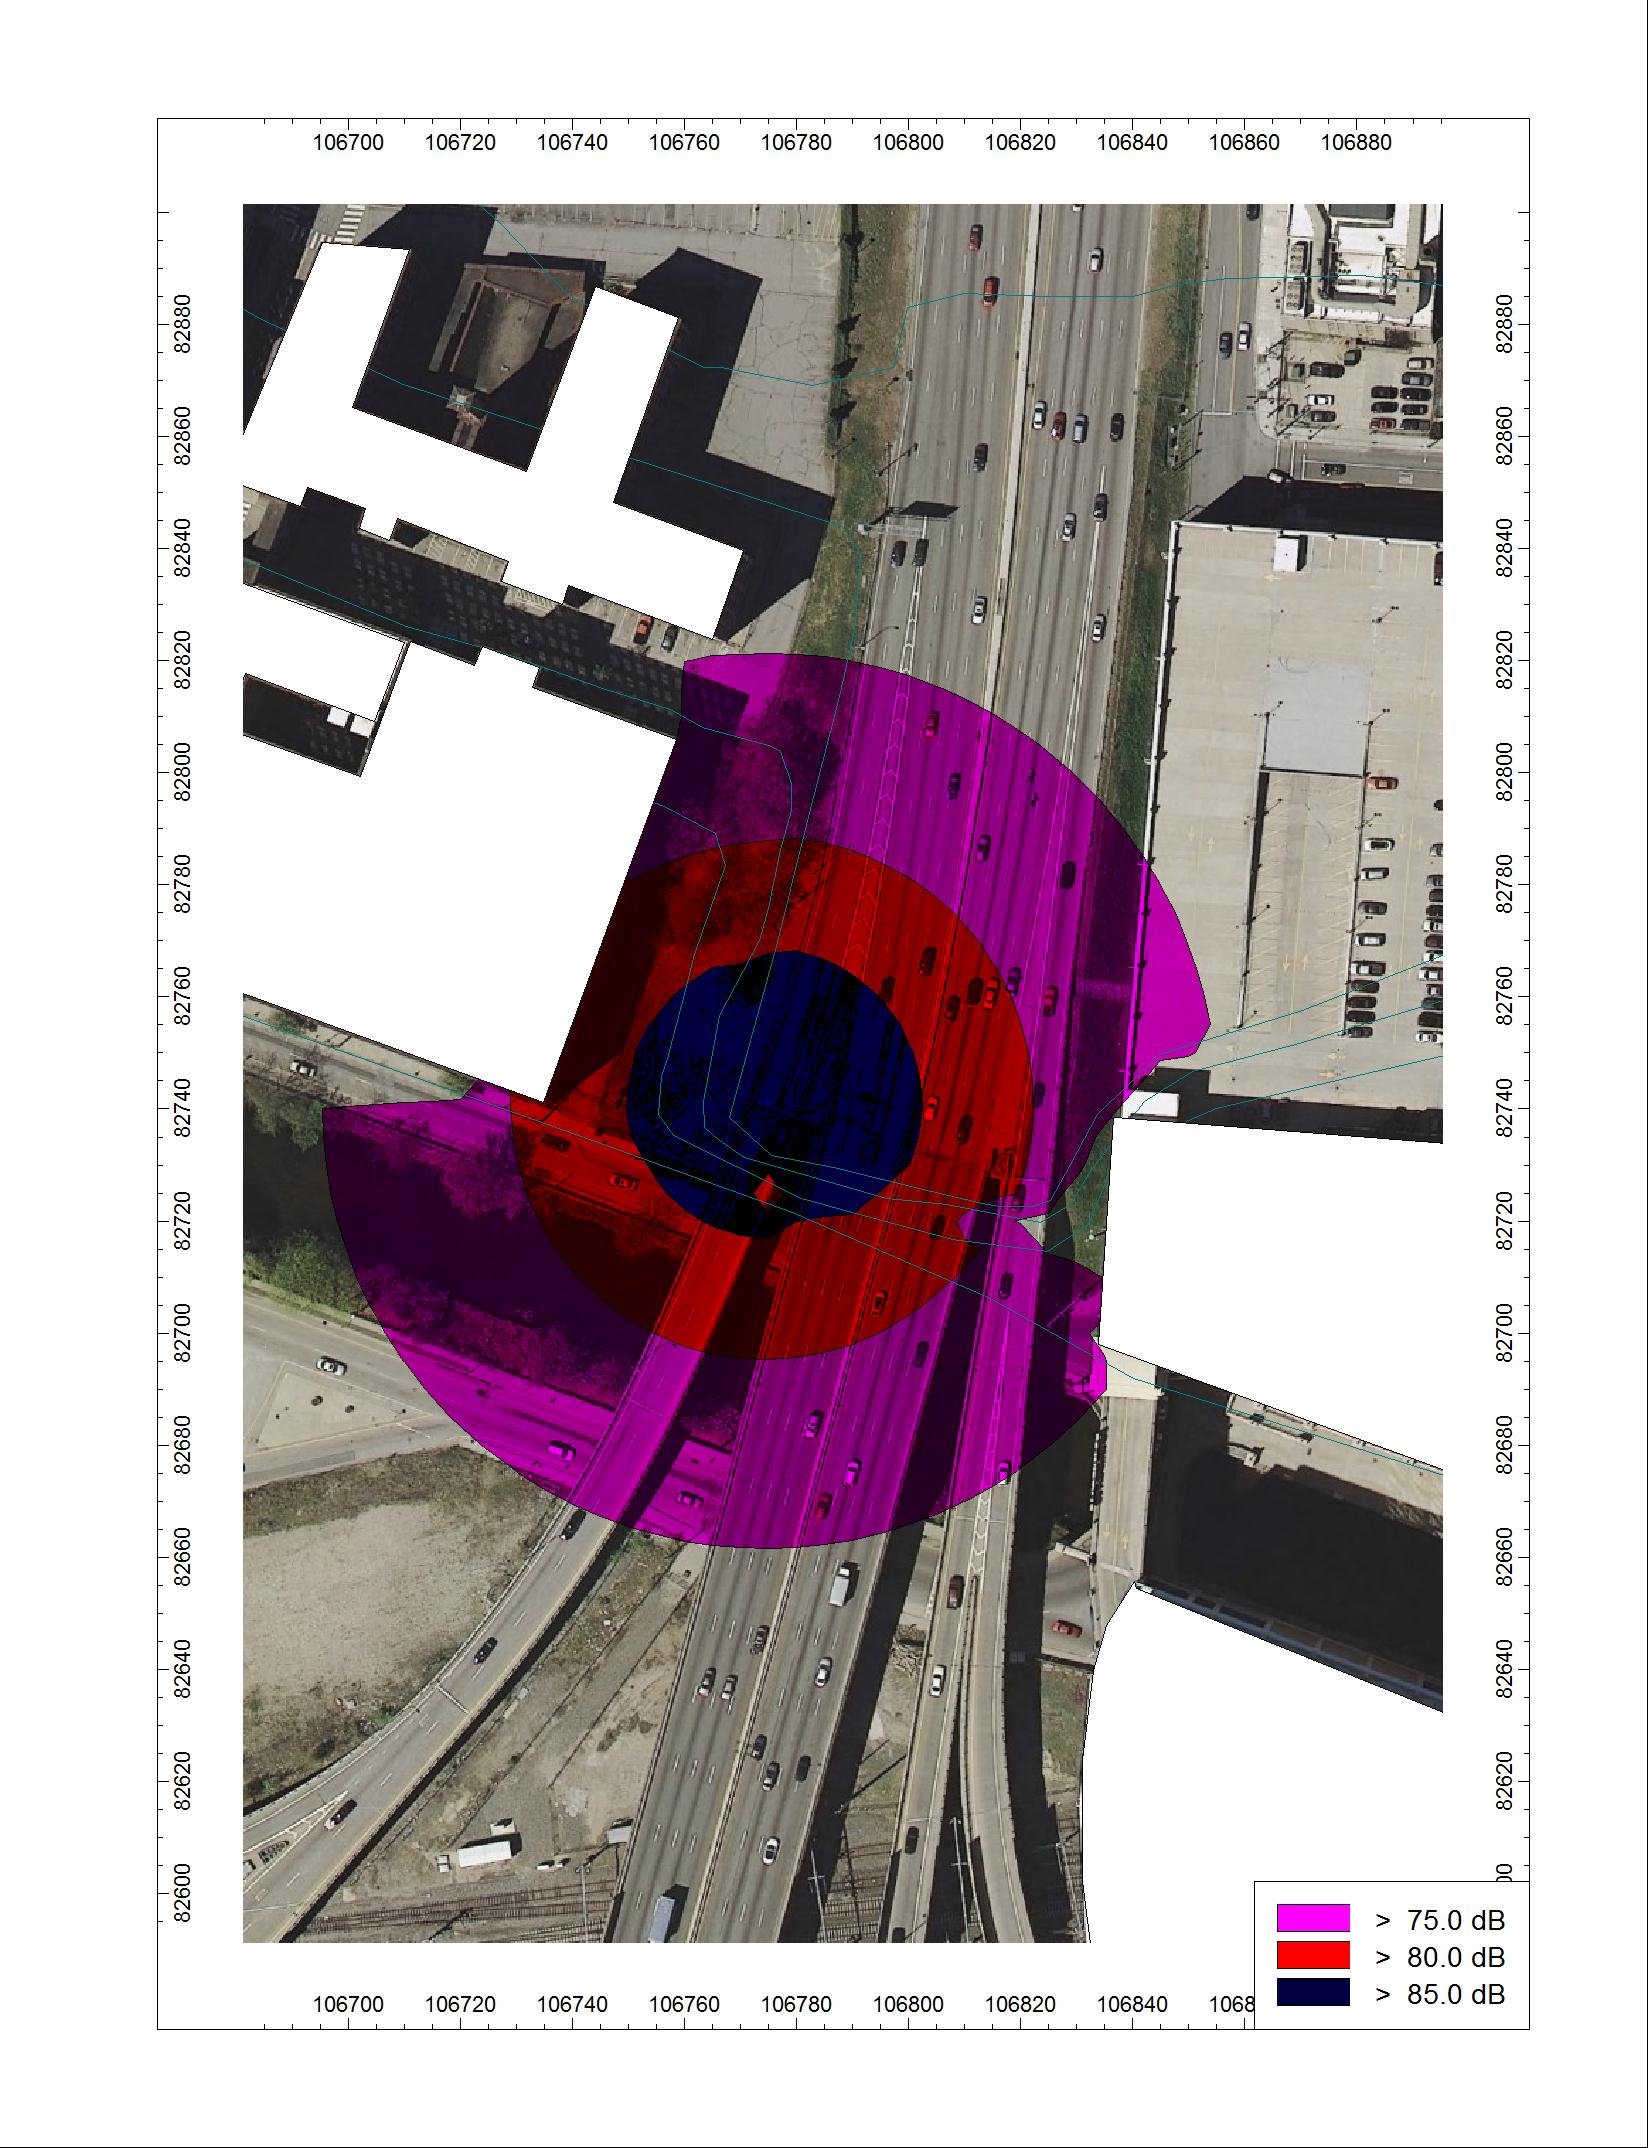
Figure 11 shows pile driving DNL noise contours for March 2015. No residential buildings are included in the 75 DNL noise contours. Subsequent Leq contour analysis reveals that no commercial buildings fall within the commercial building 80 dBA Leq contour.
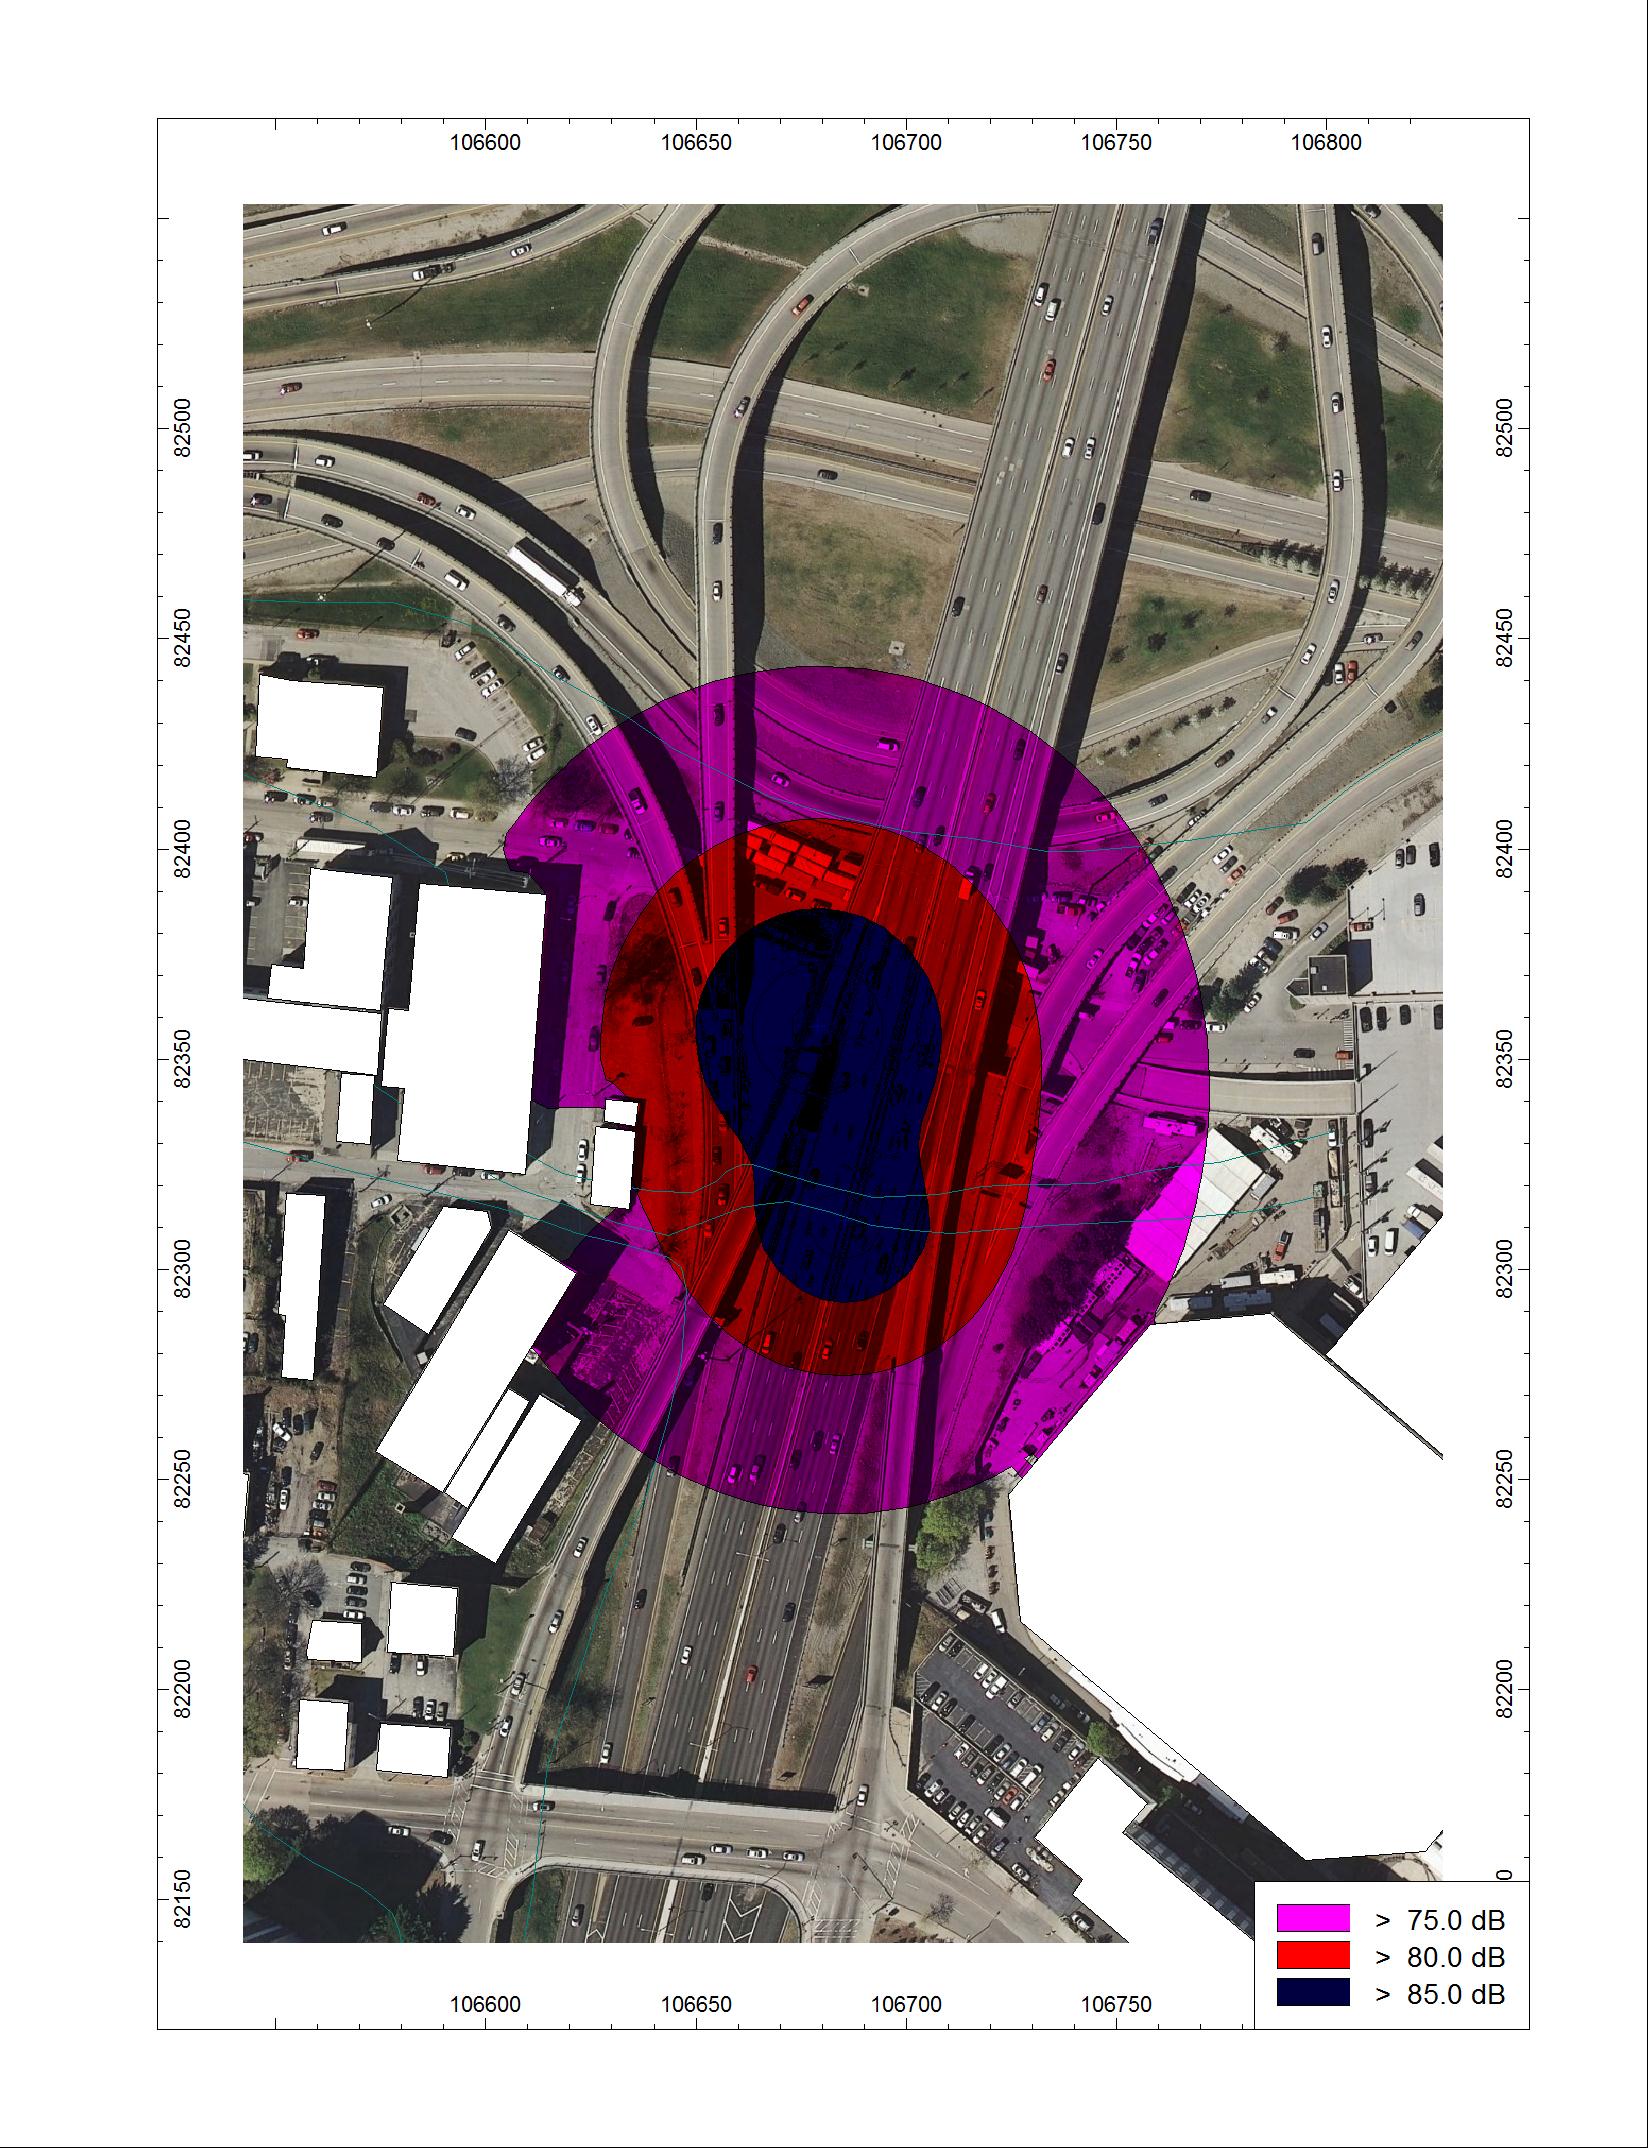
Figure 12 shows pile driving DNL noise contours for May 2015. No residential buildings are included in the 75 DNL noise contours. Subsequent Leq contour analysis reveals that no commercial buildings fall within the commercial building 80 dBA Leq contour.

3. Pile Driving Noise Mitigation
Construction noise is generally considered temporary and therefore noise mitigation is not always required. However, for longer term construction projects such as this one, noise mitigation may make sense if it can be demonstrated to be both feasible and reasonable. Pile driving noise mitigation techniques are somewhat limited but include the following (please note that many of these options may not be practical for this project, but are included here for completeness):
• Use vibratory hammers instead of impact hammers. Vibratory hammers generally produce slightly lower noise levels. (This technique is already planned for sheet driving locations where appropriate.)
• Pre-drilling. This technique can reduce pile driving effects, but is limited to certain soil conditions.
• Scheduling. In some cases pile driving can be scheduled to avoid nighttime activity.
• Noise monitoring. Often, noise monitoring is conducted during pile driving phases to determine actual compliance with project criteria.
• Barriers. Walls or temporary barriers that block the line-of-sight between pile driving and receptors can be effective.
• Heavy noise curtain. Because the pile impact location is initially 18 meters above grade, temporary walls are often impractical. A specialized noise curtain can be hung by crane and/or rigging to accomplish the same goal as a barrier wall.
• Building sound insulation. Building sound insulation refers to the installation of acoustical replacement windows and doors to improve sound isolation from outdoor noise.
The most practical noise mitigation option in this case would be the use of noise curtains. If a noise curtain can be situated to block the line-of-sight (vertically and laterally) from the hammer to receptors, a 5 dBA noise reduction can be achieved.
3.1 Noise Mitigation Results
In order to evaluate the effectiveness of pile driving noise mitigation, CADNA noise models for each month were re-run with a 5 dBA reduction (associated with a noise curtain) applied to adjacent pile driving locations. Table 3 shows the results of this analysis.
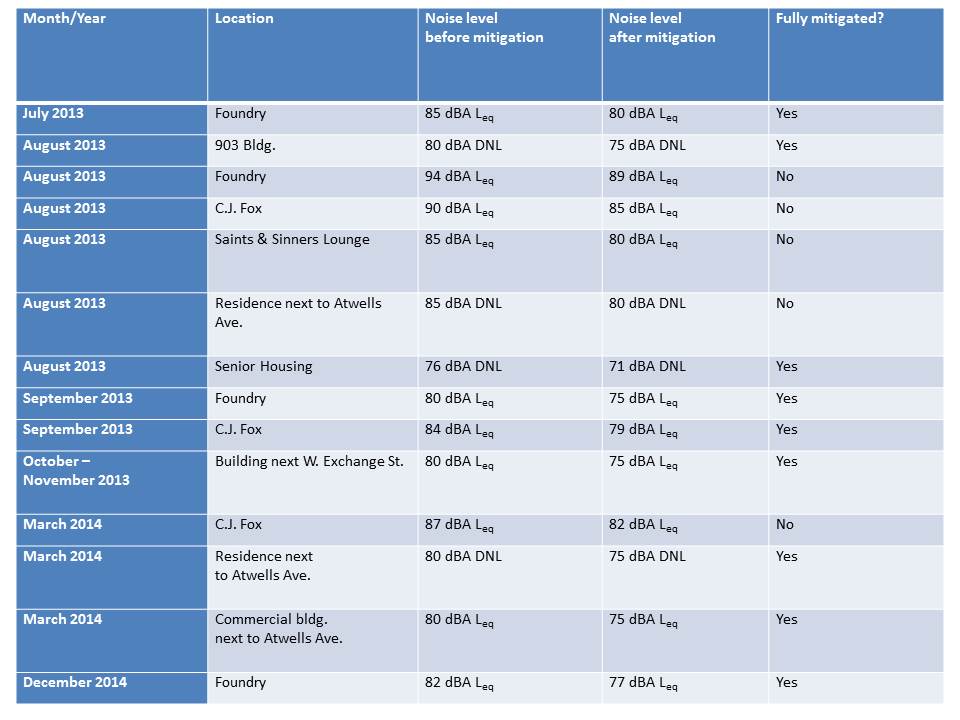
These results show that a noise curtain would mitigate noise impacts except for August 2013 for three commercial buildings and the residence next to Atwells Ave, and one commercial building in March 2014. In addition, since a noise curtain may require an additional crane(s) or rigging, its use may not be feasible at certain locations where there is no physical space for its placement. Also, it is important to note that noise complaints or lack of complaints do not necessarily correspond with noise levels being above or below impact criteria. However, adherence to established criteria, on average, helps to minimize noise impact and complaints.
4. Vibration
Based on FTA vibration data for impact and vibratory pile driving and approximate distances from pile driving to representative buildings close to pile driving, peak particle velocity (PPV), and RMS velocity (VdB- re 1 micro-inch/second) were calculated by month of construction and shown in Table 4. Peak particle velocity is typically used to evaluate the vibration response to structures whereas RMS velocity is used to evaluate human perception of vibration. Structural acceptance standards for this project are detailed in Table 1 of RIDOT Code 804.9930. Human perception of vibration generally occurs at 65 VdB.
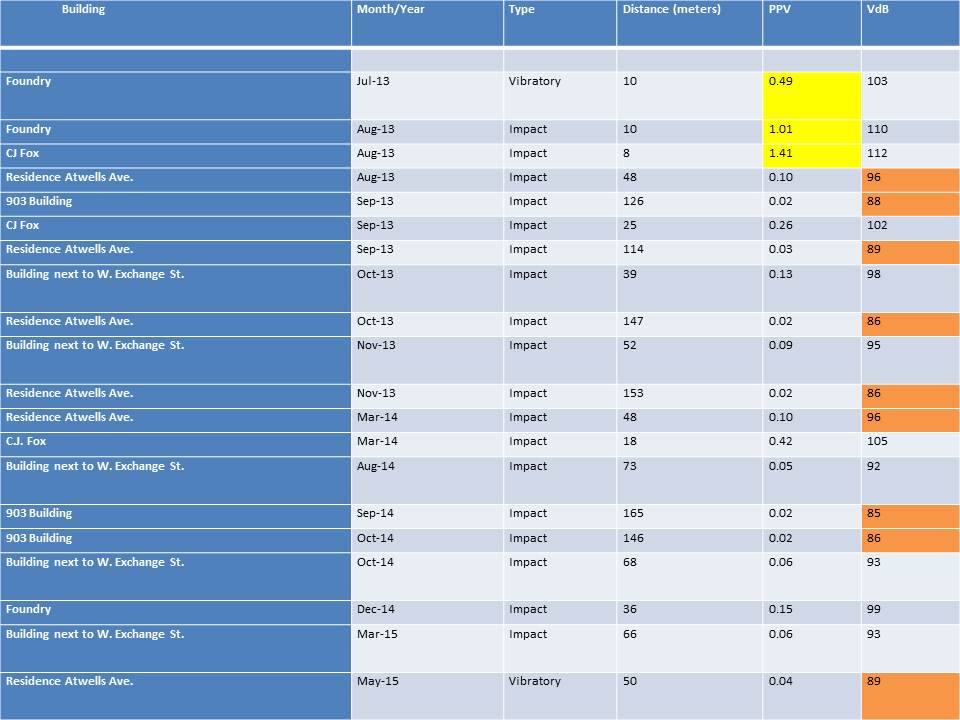
Planned pile driving which would exceed RIDOT’s acceptance standards are highlighted in yellow. Detailed procedures for handling these situations may be found in RIDOT Code 804.9930.
Residential locations exceeding 65 VdB are highlighted in orange. Since these values are substantially above 65 VdB, it is probable that these residents will be annoyed and may complain.
5. Ambient Noise Measurements
Twenty four hour noise monitoring was conducted in the project area from November 6-7, 2012 in order to characterize existing noise conditions. Table 5 shows the results of the noise measurements.

The dominant noise source at these locations was highway traffic on Interstate 95. These noise levels are relatively high, as expected in this urban environment. “Masking” refers to the fact that a new noise source may be more difficult to detect if the background noise level is sufficiently high compared with that of the new noise source. For example, the pile driving noise levels shown in Figures 1-12 can be compared with ambient noise levels to illustrate how audible pile driving will be. On the other hand, pile driving is a very impulsive sound, and therefore will likely be quite audible (i.e., in spite of the masking effects of ambient noise) throughout the project area.