Introduction
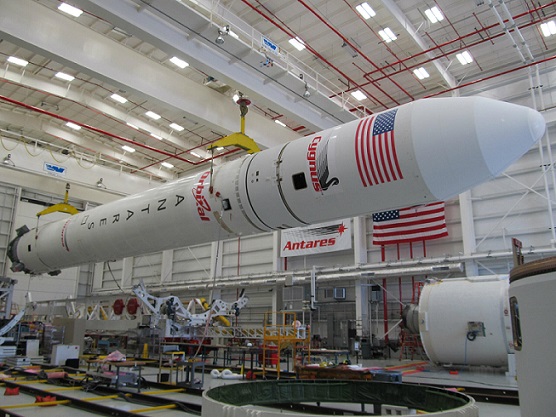
The National Aeronautics and Space Administration (NASA) is preparing a Supplemental Environmental Assessment (SEA) to address the proposed launch of the Antares 200 Configuration Expendable Launch Vehicle (ELV) from the NASA Goddard Space Flight Center’s Wallops Flight Facility (WFF), located in Accomack County, Virginia. The Federal Aviation Administration (FAA) Office of Commercial Space Transportation is a cooperating agency in the preparation of the SEA. This noise report was prepared by David Coate (acoustical consultant) on behalf of ICF/AST to determine if the Proposed Action would result in a significant noise impact, per FAA Order 1050.1E, Change 1, Environmental Impacts: Policies and Procedures (FAA Order 1050). The Antares 200 is proposed for launch in 2016 from the Mid-Atlantic Regional Spaceport (MARS) Pad 0-A at WFF. This ELV would replace the Antares 100 Configuration ELV. The Antares 200 has more thrust than the Antares 100 and thus would produce more noise. Figure 1 shows the Antares 200 ELV.
The No Action Alternative includes up to 12 launches per year of the LMLV and up to 6 launches per year of the Antares 100. The Proposed Action includes up to12 launches per year of the LMLV and up to 6 launches per year of the Antares 200.
This noise study describes the environmental noise effects associated with the Proposed Action and No Action Alternative.
Noise Metrics and Criteria
Noise Metrics
Noise is defined as unwanted sound that interferes with human activities or wildlife behavior. Noise sources can be steady-state (constant) or transient. An example of a constant noise is the noise of a fan. A sonic boom is an example of a very short transient noise event. Human perception of noise depends on a number of factors including overall noise level, number of noise events, the extent of audibility above the background ambient noise level, and frequency content. Frequency content refers to pitch. Rocket noise generally has low frequency content which can be described as a low pitch rumble. Sound is measured by the acoustical engineer in units of the decibel (dB), which is the ratio between the sound pressure of the sound source and 20 micropascals (µPa), which is nominally the threshold of human hearing. Various weighting schemes have been developed to collapse a frequency spectrum into a single dB value. The A-weighted decibel (dBA) corresponds to human hearing accounting for the higher sensitivity in the mid-range frequencies. Another sound level weighting is the C-weighted scale (dBC) which emphasizes low frequency sounds, such as sonic booms. Launch noise is a transient noise event initially at a high sound pressure level which then recedes into the background noise level as the rocket climbs in altitude. The Sound Exposure Level (SEL) is a noise metric applicable to launch noise. The SEL normalizes the acoustic energy of a launch event as if it occurred in one second. The SEL allows an “apples to apples” comparison between two different noise events which may have different durations and magnitudes. Sonic booms are typically measured in pounds per square foot (psf) for comparison with building structural damage criteria.
Noise Criteria
The Day Night Average Sound Level (DNL) is a 24- hour average of noise levels with a 10 dB penalty for noise occurring at night. This adjustment is made to account for people’s greater sensitivity to noise during nighttime hours (between 10 p.m. and 7 a.m.). DNL can be calculated on the basis of SEL and the number of daytime and nighttime noise events. Per FAA Order 1050, a significant noise impact would occur if analysis shows that the Proposed Action would cause noise sensitive areas to experience an increase in noise of DNL 1.5 dB or more at or above DNL 65 dB noise exposure when compared to the No Action Alternative for the same timeframe. In terms of hearing conservation, the Occupational Safety and Health Administration (OSHA) set a limit of 115 dBA1 for short exposure periods (less than 15 minutes). .
Launch Noise Modeling
Distributed Source Method
The FAA’s Launch Noise Model (LNM) was used to predict Antares 200 noise levels. LNM is based on Eldred’s Distributed Source Method 1 (DSM-1) reported in NASA SP-8072 2. The noise level at a specific listener location depends on the vehicle specific sound power level and the distance between the listener and rocket. Sound power level is a measure of the overall acoustic energy of the launch vehicle. The DSM-1 method determines the launch vehicle’s total sound power level based on its total thrust and exhaust velocity.
For launch vehicles with multiple engines, the DSM-1 method computes an effective exit diameter and total thrust for the vehicle. The modeled noise source comprises a range of frequencies, each of which contains a portion of the total sound power. “Distributed Source Method” refers to the fact that noise generated along the rocket plume can be modeled as separate frequency-dependent sources distributed along the rocket plume. The Eldred model was originally developed to evaluate near-field or mid-field structural concerns on launch facilities. However, in the far field where the rocket plume would be relatively small compared to the distances of concern, the distributed sources can be modeled as a single compact noise source. Noise contours generated by LNM for NEPA analyses are in this far field category.
Atmospheric Absorption
The atmosphere absorbs sound and this mechanism is a function of a number of variables including humidity, temperature, and air pressure. High frequencies are attenuated more than low frequencies. Consequently, low frequency sound of rockets can propagate through the atmosphere for greater distances than high frequency sounds. The total attenuation provided by atmospheric absorption can be considerable over long distances. LNM employs the equations detailed in ISO 96133 and ANSI S1.264 to calculate atmospheric absorption as a function of 1/3 octave band frequency.
Ground Interference
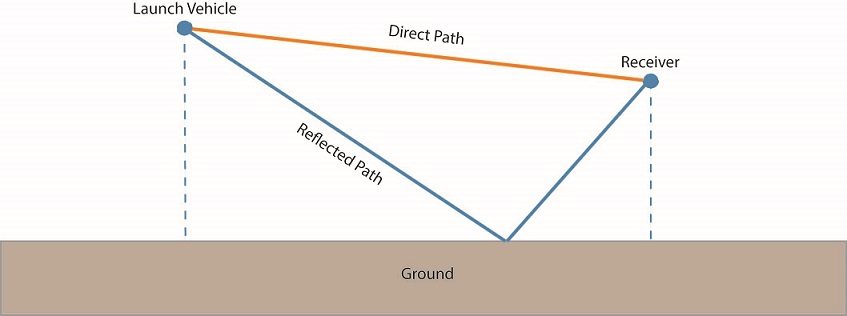
A sound source such as a rocket on its trajectory has two ray paths to an observer location, a direct path and a reflected path off of the ground, both combining at the observer location (as shown in Figure 2). If the ground is soft, the total combined noise level can be reduced somewhat, whereas if the surface is hard (for example, water), the total combined noise level can be increased somewhat. These acoustical interactions are complex, including interference at specific frequencies due to a phase shift of the reflected acoustic ray.
The ground interference equations in references 5 to 26 are incorporated into LNM. Ground surfaces and water bodies with associated flow resistivity values were input into LNM according to a user-specified grid system.
Acoustic Efficiency
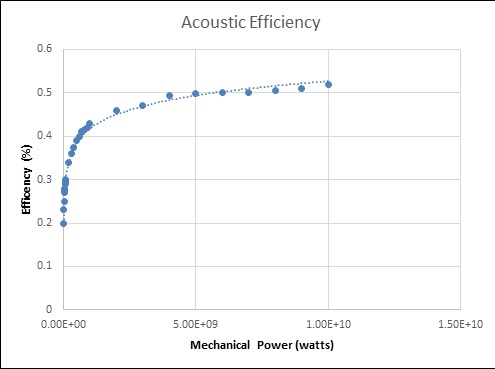
The acoustic efficiency of a rocket engine refers to how much mechanical energy is converted to sound. Smaller rockets typically have lower acoustic efficiency than larger rockets. Figure 3 shows the relationship between acoustic efficiency27 and the launch vehicle mechanical power (in watts). LNM calculates the acoustic efficiency based on this relationship.
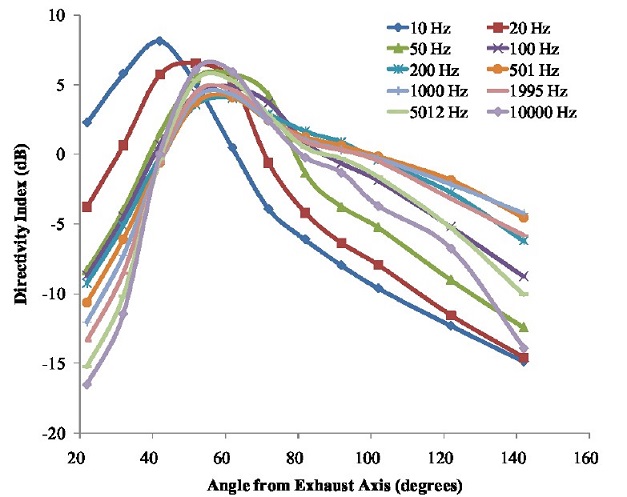
Directivity
Rocket engine/plume generated noise is highly directive. The frequency content of the rocket noise is dependent upon the angle of orientation between the rocket plume and listener location. In 2009, NASA’s Project Constellation28 updated the rocket engine directivity data originally included in Eldred’s methodology. Figure 4 shows the results of this data collection effort which greatly improved the accuracy and range of angles between the source and listener location. LNM calculates directivity based on these improved directivity data.
Doppler Shift
Doppler shift refers to the effect of a moving sound source either coming toward or moving away from an observer. The frequency of the sound will increase when the sound source approaches the observer and will decrease when moving away from the observer. A common example is the sound of a siren changing in frequency or pitch as the vehicle passes by an observer.
As a launch vehicle ascends away from an observer, the doppler shift would result in a downward shift of the launch noise frequencies. As a result, the A-weighted noise level would also decrease since A-weighting de-emphasizes low frequencies. LNM includes algorithms to calculate the doppler shift.
Alternatives Studied
In addition to launches, the No Action Alternative and Proposed Action addressed in the SEA include noise-generating activities such as range surveillance (helicopters and fixed-wing aircraft). This noise report does not address those activities because their contribution to the annual average DNL would be small compared with launch vehicle noise contributions.
No Action Alternative
The No Action Alternative includes up to 12 launches per year of the LMLV at MARS Pad 0-B and up to 6 launches per year of the Antares 100 at MARS Pad 0-A.
Proposed Action
The Proposed Action includes up to 12 launches per year of the LMLV at MARS Pad 0-B and up to 6 launches per year of the Antares 200 at MARS Pad 0-A. The Antares 200 has 18% more thrust than the Antares 100 and thus would produce slightly more noise than the Antares 100. However, the LMLV has more thrust than either Antares vehicle and therefore would produce more noise than both Antares vehicles. The following analyses compare the noise effects of the Proposed Action and No Action Alternative.
Input Parameters
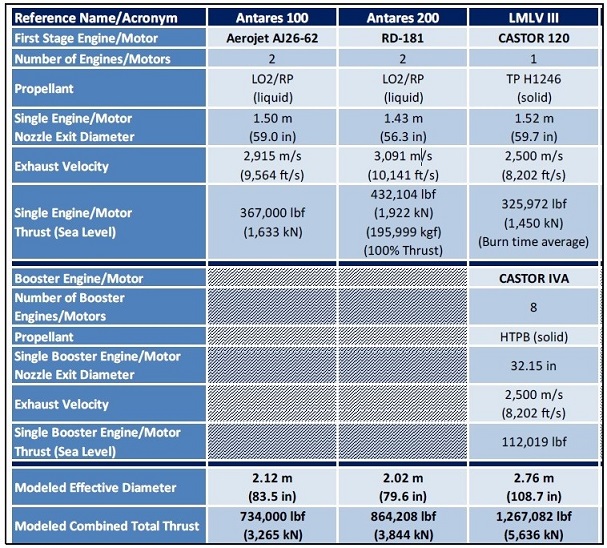
Table 1 shows the coordinates of the launch pads, parameters of the Antares 100 and 200, and parameters of the LMLV provided by NASA for input into LNM. NASA also provided trajectory files for these launch vehicles including latitude, longitude, velocity, and altitude as function of time. LNM reads these files to compute noise levels on the ground for a user-specified grid system.
Results
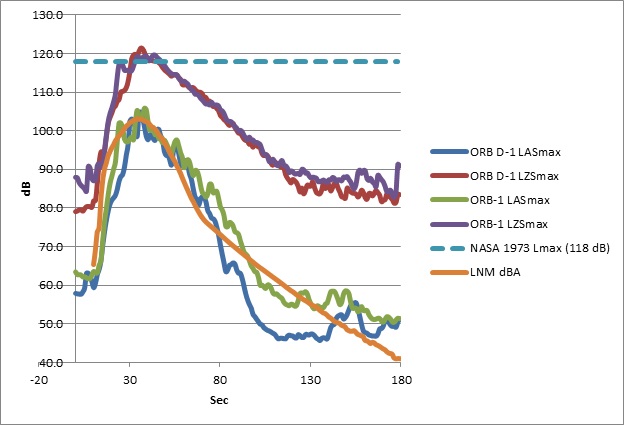
Comparison of LNM results to measurements NASA conducted noise measurements of Antares 100 launches at a location (37.855709°,-75.510684°) approximately 3,135 meters to the west of Pad 0-A. Time histories of those launches are shown in Figure 4 along with LNM-generated results using Antares 100 parameters at this coordinate. As can be seen by this figure, the LNM results are in excellent agreement with measured results.
Comparison of Antares 200 to Antares 100
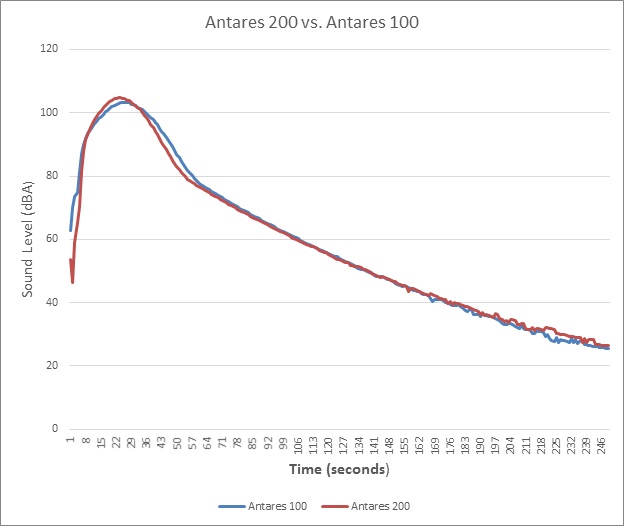
Figure 6 shows a comparison between the LNM-modeled Antares 100 and Antares 200 time histories at the nearest residence (37.838404°,-75.522186°). As can be seen from this figure, the noise signatures of the two vehicles are very similar, with the Antares 200 only slightly noisier (less than 2 dBA) than the Antares 100. These differences are attributable to the different input parameters (Table 1), slightly different trajectories, and detailed ground interference modeling.
Hearing Conservation
Modeling for the Antares 200 shows that the 115 dBA contour line would be approximately 1,100 meters from the pad, compared with approximately 970 meters for the Antares 100.
DNL Contour Maps
Figure 7 shows DNL contours for the Proposed Action zoomed out to show the detailed effects of ground interference associated with the various water bodies intervening with land. The innermost contour is the 65 DNL contour. The green rocket trajectory is associated with the Antares 100, the pink trajectory is associated with the Antares 200, and the blue trajectory is associated with the LMLV.
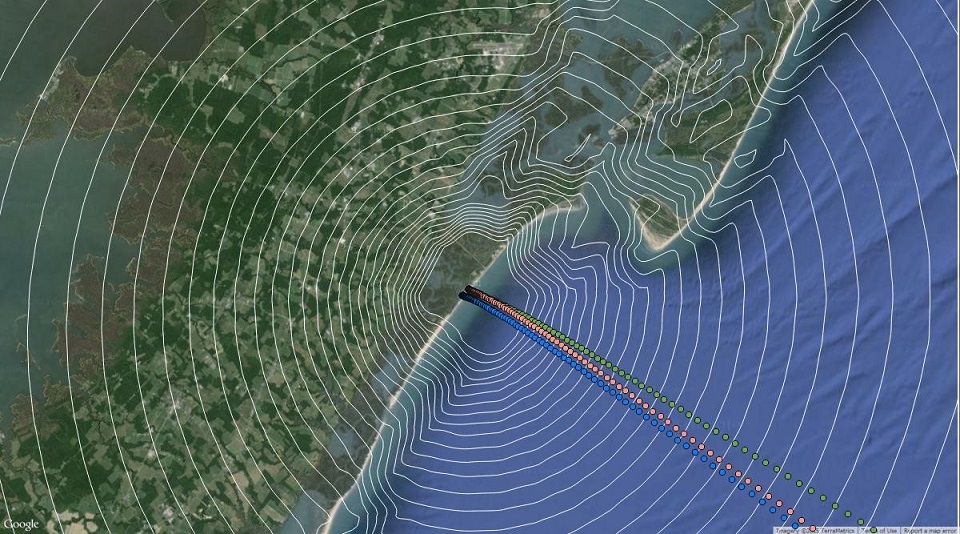
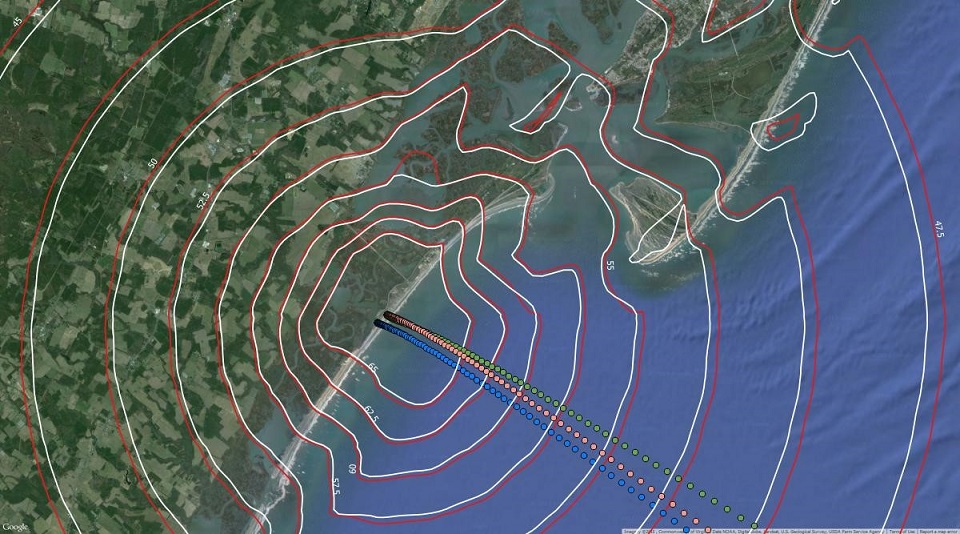
Figure 8 shows the Proposed Action DNL contours (labeled in red) compared with the No Action DNL contours (labeled in white). As can be seen in this figure, the Proposed Action DNL contours are slightly larger than the No Action DNL contours, but only by less than 1 dB.
There are no noise sensitive receptors (e.g., residences) within the 65 DNL contour and due to the essentially negligible increase in noise, the Proposed Action would not comprise a significant noise impact according to FAA Order 1050.
Bibliography
1. Occupational Health and Safety and Health Administration, OSHA 1019.95, 1996
2. K. Eldred, Acoustic Loads Generated By the Propulsion Systems, National Aeronautics and Space Administration, 1971
3. Acoustics-Attenuation of Sound During Propagation Outdoors-Part 1: Calculation of the Absorption of Sound by the Atmosphere, ISO 9613-1, 1993
4. Method for Calculation of the Absorption of Sound by the Atmosphere ANSI S1.26-1995.
5. Chien C. F. and Soroka W. W. A note on the calculation of sound-propagation along an impedance surface. Journal of Sound and Vibration, 69(2):340–343, 1980.
6. Goebiewski, Adam, Simple Methods For Determination Of The Acoustical Properties Of Ground Surfaces, University Institute of Acoustics Umultowska 85, 61-614 Poland June 21, 2007
7. Chien and Soroka. Sound propagation along an impedance Plane .Journal of Sound and Vibration Volume 43, Issue 1, 8 November 1975, Pages 9–20
8. C.I. Chessell, Propagation of Noise Along a Finite Impedance Boundary, Journal of the Acoustical Society of America, Vol. 62, No. 4, 1977.
9. G.J.J. Ruijgrok, Elements of Aviation Acoustics, Delft University Press /1993
10. Daigle G. A. Effects of atmospheric turbulence on the interference sound waves above a finite impedance boundary. - January 1979. - Vol. 65.
11. Embleton T.F.W., Piercy J.E. and Daigle G.A. Effective flow resistivity of ground surfaces determined by acoustical measurements. - 1983. - Vol. 74. - pp. 1239-1244.
12. T.F.W. Embleton, J.E. Piercy and N. Olsen, Outdoor Sound Propagation over Ground of Finite Impedance, Journal of the Acoustical Society of America, Vol. 59, No. 2, 1976.
13. P.J. Dickinson and P.E. Doak, Measurements of the Normal Acoustic Impedance of Ground Surf aces, Journal of Sound and Vibration (13), 1970.
14. M.E. Delany and E.N. Bazley, Acoustical Properties of Fibrous Absorbent Materials, Applied Acoustics (3), 1970.
15. K. Attenborough, Predicted Ground Effect for Highway Noise, Journal of Sound and Vibration, 81(3), 1982.
16. Ground Effects in FAA’s Integrated Noise Model, United States Department of Transportation, John A. Volpe National Transportation Systems Center, Acoustics Facility, Federal Aviation Administration, Office of Environment and Energy, AEE-120, 1997
17. C.A. Yoerkie and R. Larson, Prediction of Free-Field Noise Levels from Pole Microphone Measurements, AIAA, Paper 80-1058, 1980.
18. T. Embleton, Sound Propagation Outdoors- Improved Prediction Schemes for the 80s, Noise Control Engineering, 1982
19. W.L. Willshire, Jr., Assessment of Ground Effects on the Propagation of Aircraft Noise, The T-38 Flight Experiment, NASA, TP-1747, 1980.
20. S.P. Pao, A.R. Wenzei and P.B. Oncley, Prediction of Ground Effects on Aircraft Noise, NASA, TP-II04, 1978.
21. K. Rasmussen, Approximate Formulae for Short-Distance Outdoor Sound Propagation, Applied Acoustics, 1990
22. W.L. Willshire, Jr. and P.A. Nystrom, Investigation of Effects of Microphone Position and Orientation on Near-Ground Noise Measurements, NASA, TP-2004, 1982.
23. Handbook of Noise and Vibration Control. Malcom Crocker 2007
24. Springer Handbook of Acoustics. Rossing, 2014
25. Handbook of Signal Processing in Acoustics, Havelock, 2008
26. Predicting Outdoor Sound, Attenboro p 55., 2007
27. S. H. Guest, Acoustic Efficiency Trends for High Thrust Boosters, NASA TN D-1999, MSFC, 1964
28. J. Haynes and J. R. Kenny, Modifications to the NASA SP-8072 Distributed Source Method II, in 15th AIAA/CEAS Aeroacoustics Conference (30th AIAA Aeroacoustics Conference), Miami, Florida, 2009