Introduction
The Office of Commerical Space Transportation (AST), a branch of the Federal Aviation Administration oversees commercial space launch activity in the U.S. Commercial space launch facilities and sites are being located and permitted through the NEPA process in various locations in the U.S. Launch noise and sonic booms as a launch vehicle passes Mach 1 is increasingly a concern especially for launch sites located near populated areas. In the past, this was not necessarily an issue because the major launch sites (such as Cape Canaveral) were located adjacent to oceans and launch vehicle trajectories directed most of the noise and sonic booms over the ocean.
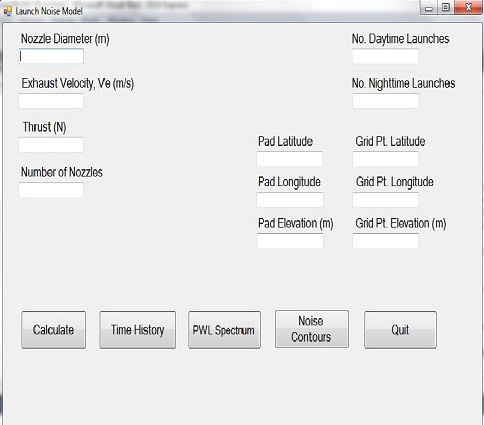
To address the siting of new launch facilities, computational noise modeling tools are needed to calculate rocket noise levels for comparison with various noise impact thresholds. On behalf of AST/ICFI, David Coate developed the Launch Noise Model (LNM). The LNM is a Windows application that computes noise contours for a user defined latitude and longitude for a launch facility. The main user interface is shown in Figure 1.
Input and Output
Input values for LNM include the launch pad latitude, longitude, and elevation. Rocket input parameters include nozzle diameter, number of nozzles, exhaust velocity, and thrust. A user can input individual receptor locations for detailed analysis. The program will also calculate cumulative noise metrics such as DNL on the basis of user specified number of daytime and nighttime launches.
LNM generates numerous other noise contour metrics including CDNL, Maximum A-weighted (dBA Max), Overall Sound Pressure Level (OASPL, dB), and Sound Exposure Level (SEL). Grid files for these metrics are generated for a user-specified number of grid points in the format of latitude, longitude, dB. Grid files are then read into NMPlot. NMPlot is the standard noise contour plot program used by FHWA’s Traffic Noise Model (TNM) (for highway noise modeling), FAA’s Integrated Noise Model (INM) (for civil aircraft), and DOD’s NOISEMAP (for military aircraft). Finally, NMPlot files are converted to KML format for overlay in Google Earth.
LNM reads a launch vehicle trajectory data file that includes rocket latitude, longitude, altitude, and velocity, for each second along the rocket trajectory.
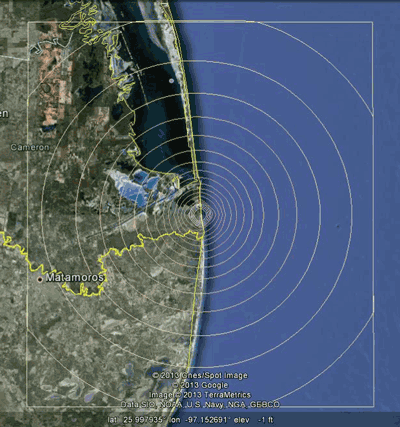
Figure 2 shows an example LNM noise contour output. This example is OASPL contours for SpaceX’s Falcon 9 Heavy launch vehicle for a proposed launch facility in Texas. In this example, the noise contours bulge towards the east, along the Falcon 9 launch trajectory in that direction.

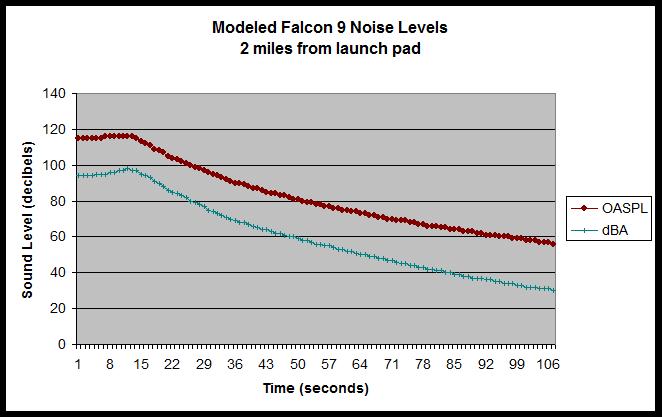
LNM also computes time history graphs of noise level versus time at a user specified latitude and longitude. Figure 3 shows an example LNM time history graph. In addition, LNM can compute a graph of the rocket sound power level as a function of frequency.
LNM Algorithms
LNM’s algorithms are based on the following well established methods:
1) “Acoustic Loads Generated by the Propulsion System” Ken Eldred, NASA, 1971
2) “Progress and Problems in Rocket Noise Prediction for Ground Facilities” L.C. Sutherland, AIAA 1993
Rocket noise is highly directive as a function of angle off-axis of the exhaust flow. Reference 1 provides directivity data as a function of Strouhal number and angle. Strouhal number, S, is a dimensionless value that allows direct comparison of rocket sound power level spectra.
Where
De= effective nozzle diameter (m)
Ve= exhaust velocity (m/s)
More recent data from the NASA Ares I project are incorporated into LNM. A sample fifth-order polynomial curve fit of the NASA directivity data, used in LNM, is shown in Figure 4.
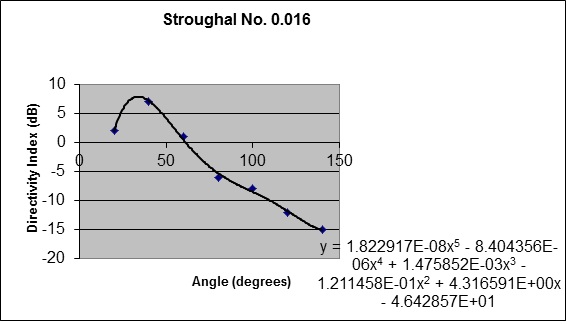
Figure 4. Example curve fit of NASA Directivity Data
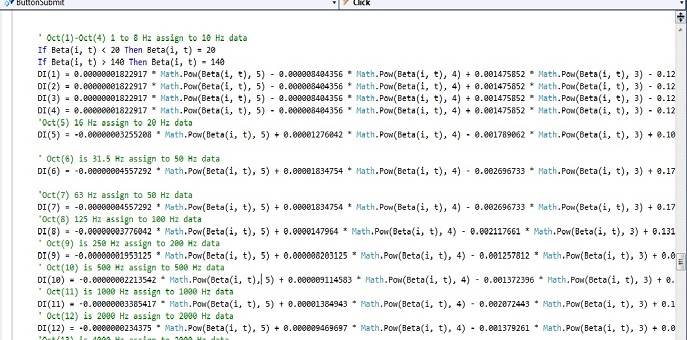
Figure 5 shows a sample section of the .net framework code in LNM that performs the directivity calculations.
Depending on the exact rocket trajectory, the directivity of rocket sound can result in dramatically changed sound levels and spectra on the ground. For example, as the rocket pitches over in order to reach its proper angle of orbital penetration, the rocket’s orientation to the ground may be much different than its orientation to the ground immediately after launch.
As the rocket increases in velocity, the peak frequency Fp (usually less than 60 Hz) shifts downwards due to doppler shift. That observed frequency, Fo, is
Where
V = rocket velocity (m/s)
Theta= angle of observer off axis of exhaust flow (radians)
LNM incorporates the atmospheric absorption coefficients from ISO 9613 Part 1 “Calculation of the Absorption of Sound by the Atmosphere” with a 15 dB attenuation limit, as specified by the standard.
LNM computes rocket-generated sound pressure levels, in octave bands, for every second along the rocket’s trajectory at hundreds (or perhaps thousands- if selected by the user) of grid points on the ground. As discussed previously, noise contours are then generated for a variety of noise metrics. Figure 6 shows the results of these effects over time in 10 second slices of time during the Falcon 9 launch trajectory towards the east of Padre Island, Texas.